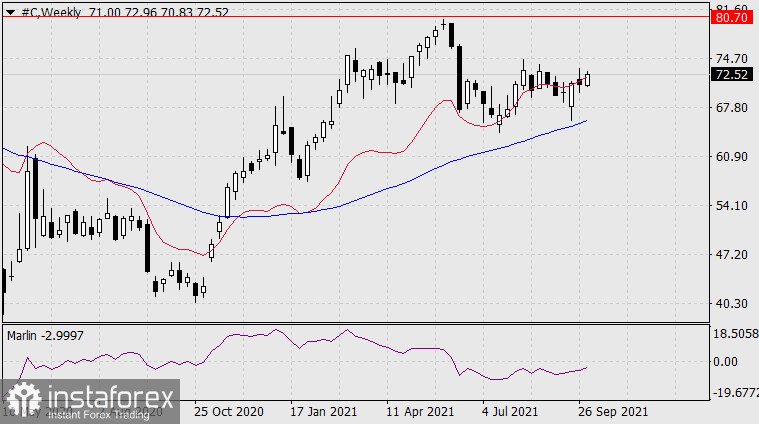
Buying shares of Citigroup (#C), the largest financial corporation in the US. On the weekly chart, the price went above the resistance of the balance line (red), giving a buy signal. The Marlin oscillator is headed upward in the negative zone. The bullish target is seen at 80.79, the high as of February 2021 and January 2018.

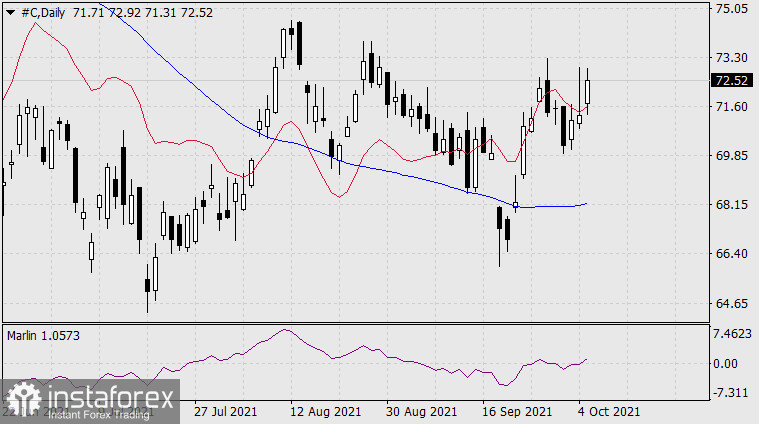
On the daily chart, the price consolidated above the balance line, the Marlin oscillator moved to the positive zone. The quote is expected to continue rising today.

Selling shares of Master Card (#MA), a global payments company.

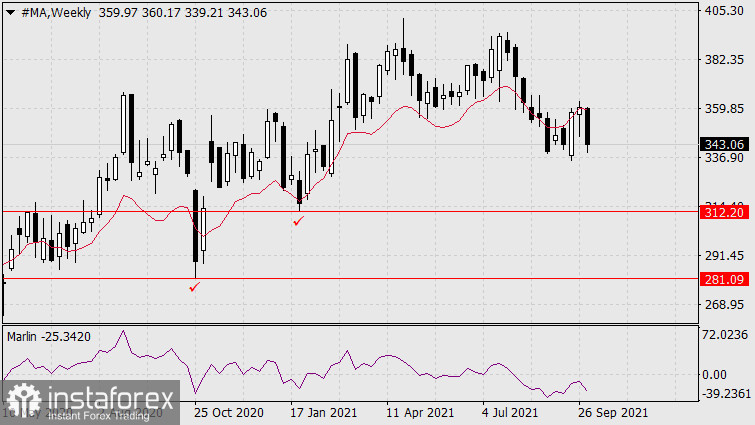
On the weekly chart, the price reversed and went down from the balance line. The Marlin oscillator is headed down in the negative zone. The target is seen at the January 2021 low of 321.20. Then, the price may go down to the October 2020 low of 281.09.

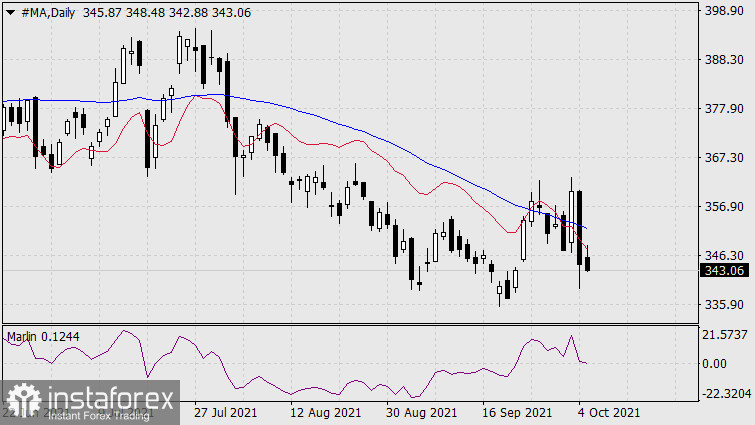
On the daily chart, the price consolidated below the balance line (red) and the Kruzenshtern line (blue). The Marlin oscillator is trying to leave the negative zone. The downward trend is expected to develop.
 English
 Русский
 Bahasa Indonesia
 Bahasa Malay
 ไทย
ไทย Español
 Deutsch
 Български
 Français
 Tiếng Việt
 中文
中文 বাংলা
বাংলা हिन्दी
 Čeština
 Українська
 Română

