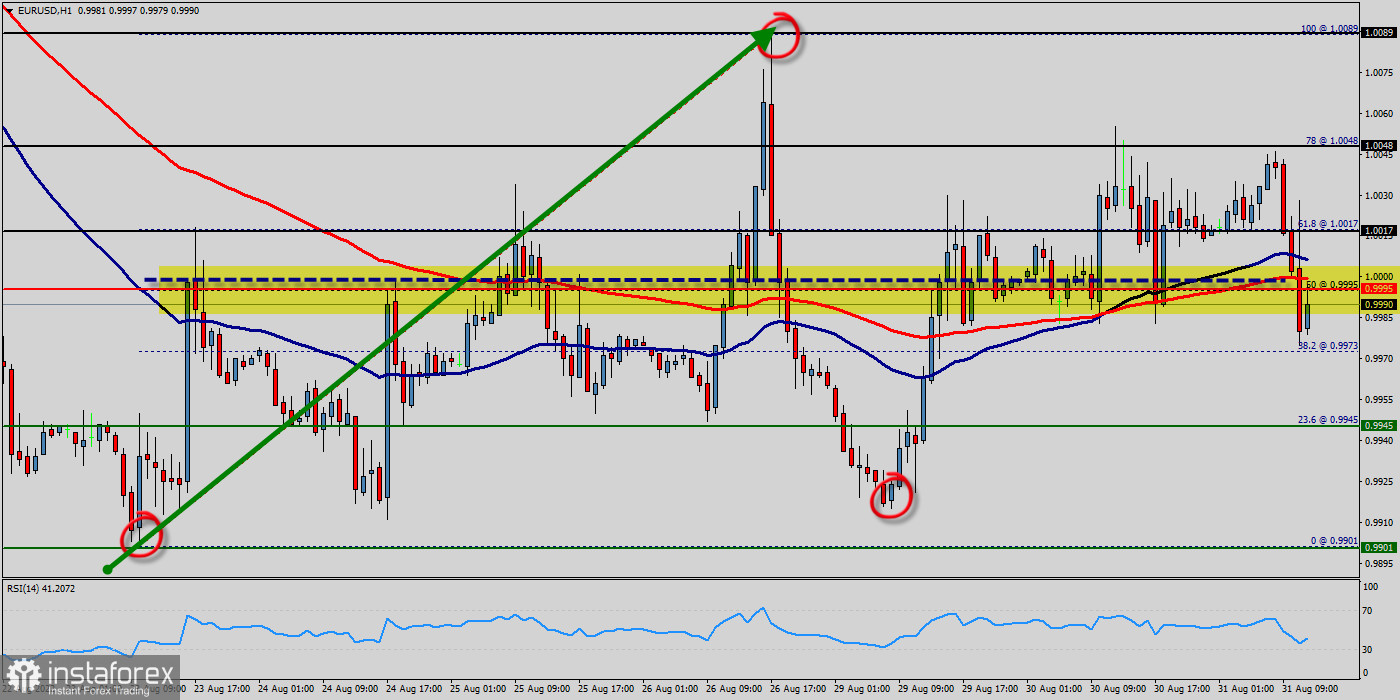
The EUR/USD pair traded with strong positivity yesterday to test the most important support at the area of 0.9901-0.9945, and bounced bullishly from there to test 1.0188 level now and attempts to breach it, which encourages us to continue suggesting the bullish trend for the upcoming period.
The Euro strengthened to around the daily pivot point of 0.9995, slightly above the key 1 USD parity mark after flash reports on growth and inflation topped analysts' estimates reinforcement the case for bigger and faster ECB interest rate hikes - be careful in it and we never advise to trade it at anytime.
The euro to dollar (EUR/USD) exchange rate has mostly been in a climb since peaking at 1 USD in August thsi week. It briefly rise above the price of 0.9901 in August for continuing to rising above the levels of 0.9901 and 0.9945. The euro (EUR) has tumbled close to 5% against the US dollar (USD) year-to-date as the economic outlook in Europe has deteriorated significantly.
Furthermore, the price has been set above the strong support at the level of 0.9945, which coincides with the 23.6% Fibonacci retracement level. This resistance has been rejected several times confirming the downtrend. The price needs to step above the last level to confirm the continuation of the bullish bias towards 1.0017 followed by 1.0048 levels as next main targets.
In the short term, there could be an acceleration of the basic bullish trend on the EUR/USD pair. This is a positive signal for buyers. As long as the price remains above the price of 1 USD, a purchase could be considered.
The RSI is still signaling that the trend is upward as it is still strong above the moving average (100). This suggests the pair will probably go up in coming hours. Accordingly, the market is likely to show signs of a bullish trend.
Therefore, there is a possibility that the EUR/USD pair will move upside and the structure of a raise it does not look corrective. The trend is still above the 100 EMA for that the bullish outlook remains the same as long as the 100 EMA is headed to the upside.
The first bullish objective is located at 1.0048. The bullish momentum would be boosted by a break in this resistance. Buyers would then use the next resistance located at 1.0089 as an objective on the hourly chart. Since the trend is below the price of 0.9945, the market is still in an uptrend. Overall, we still prefer the bullish scenario.
On the other hand, if the EUR/USD pair fails to break out through the resistance level of 1.0089; the market will decline further to the level of 0.9901 (daily support 2).
 English
 Русский
 Bahasa Indonesia
 Bahasa Malay
 ไทย
ไทย Español
 Deutsch
 Български
 Français
 Tiếng Việt
 中文
中文 বাংলা
বাংলা हिन्दी
 Čeština
 Українська
 Română

