Hello, dear traders!
Yesterday, the British pound gained in value significantly against the US dollar. As noted in today's article on EUR/USD, this was most likely due to technical factors. Speaking of today's fundamental events, the dynamics of the currency pair may be affected by data on the UK Services Purchasing Managers' Index as well as statistics on activity in the US services sector from the Institute for Supply Management. Now let's consider the pound/dollar pair from a technical point of view.
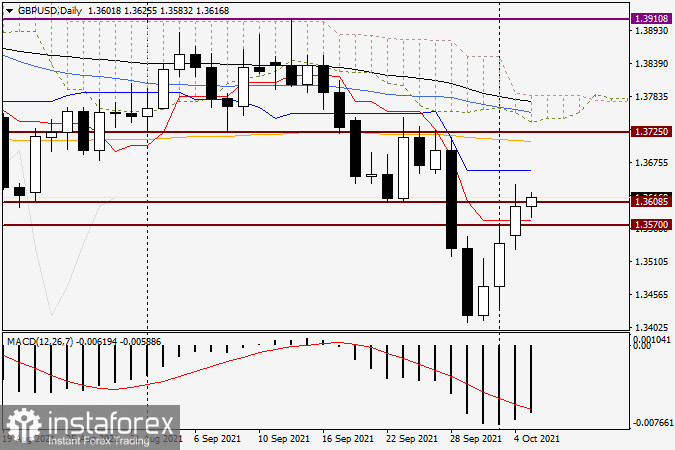
Daily chart

Yesterday, I recommended refraining from entering the market and following the price behavior near the broken 1.3570 support level. On Monday, the GBP/USD pair closed the trading day above this mark, at the level of 1.3602. Thus, the pair returned above the broken support level of 1.3570, and bulls managed to close the session on the first day of the week above the important technical level of 1.3600. Therefore, it can be concluded that the price is likely to form a false breakout at the support level of 1.3570. The fact that the price closed trading on October 4 above this mark, the Tenkan red line, and the level of 1.3600, indicates that the pair is ready to continue its upward movement. In this regard, the current trading day will be especially important. However, in my opinion, much will depend on Friday when data on the US labor market will be published.
If we consider the support level and the Tenkan line to be falsely broken, a pullback to them should be considered as an opportunity to open long positions. In principle, at the time of preparing this article, the pair has nearly completed its pullback. After falling to the level of 1.3583, the pair is expected to turn around towards the upside and resume yesterday's growth. If this happens, the quote will most likely reach the area of 1.3660, that is, the blue Kijun line of the Ichimoku Cloud indicator. In case the price overcomes the Kijun line, the pound sterling will have to face another challenging price area of 1.3700-1.3710. In truth, the British pound continues to play tricks on market participants as there is no definite answer about its further direction, especially following yesterday's closing above 1.3600. In this regard, I will consider both scenarios.
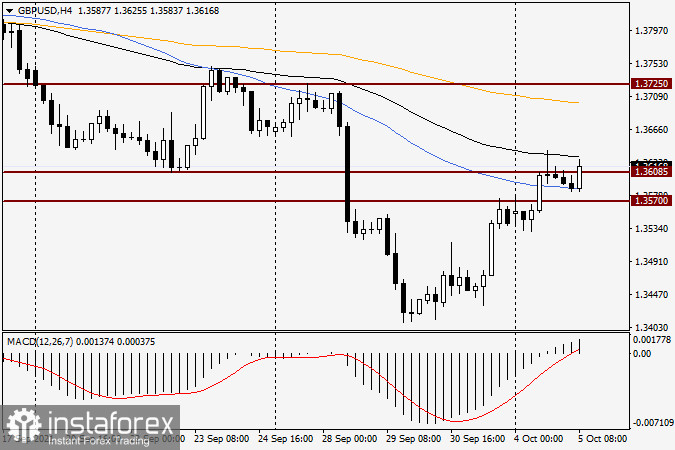
H4

As for the four-hour chart, it is worth looking for a sell signal near 1.3700. This level is very strong from a technical point of view. Besides, there is also a strong 200-day exponential moving average (orange) on the H4 chart, which can limit the pair's bullish run. Long positions can be considered from the price area of 1.3600-1.3570. To sum up, I would like to point out once again that technically, the situation with the GBP/USD is rather uncertain, so be careful!
Good luck!
 English
 Русский
 Bahasa Indonesia
 Bahasa Malay
 ไทย
ไทย Español
 Deutsch
 Български
 Français
 Tiếng Việt
 中文
中文 বাংলা
বাংলা हिन्दी
 Čeština
 Українська
 Română

