Technical Market Outlook:
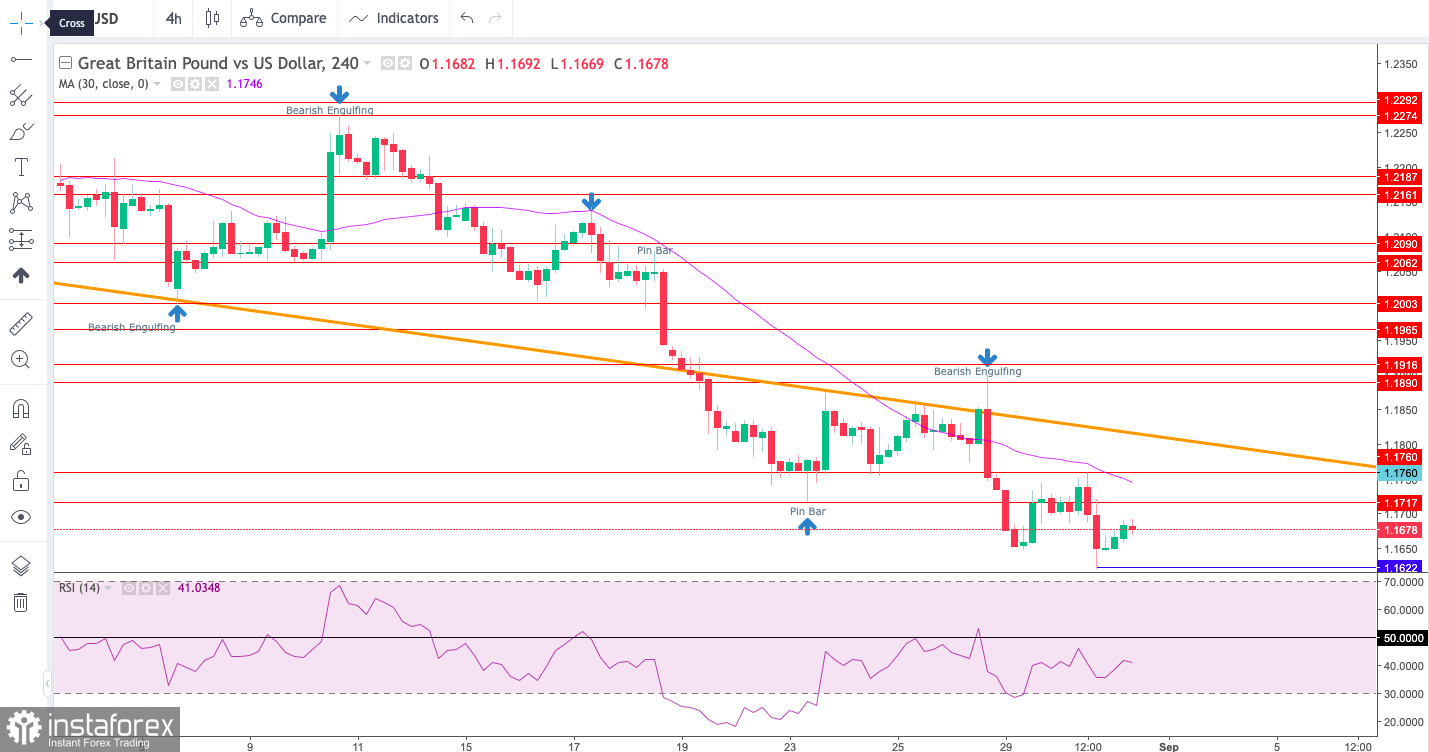
The GBP/USD pair has made a new, fresh low at the level of 1.1620 and continues to move below the trend line resistance. The nearest horizontal technical resistance is seen at the level of 1.1760 and this level is the next target for bulls in a case of a local pull-back. The momentum remains weak and negative, however, there is a bullish divergence seen on the H4 time frame chart between the price action (last low) and momentum. The larger time frame trend (daily and weekly) remains down until further notice.

Weekly Pivot Points:
WR3 - 1.18043
WR2 - 1.17392
WR1 - 1.17002
Weekly Pivot - 1.16741
WS1 - 1.16351
WS2 - 1.16090
WS3 - 1.15439
Trading Outlook:
The Cable is way below 100 and 200 DMA , so the bearish domination is clear and there is no indication of down trend termination or reversal. The bulls has failed big time to continue the corrective cycle after a big Bearish Engulfing candlestick pattern was made on the weekly time frame chart last week. The next long term target for bears is seen at the level of 1.1410. Please remember: trend is your friend.
 English
 Русский
 Bahasa Indonesia
 Bahasa Malay
 ไทย
ไทย Español
 Deutsch
 Български
 Français
 Tiếng Việt
 中文
中文 বাংলা
বাংলা हिन्दी
 Čeština
 Українська
 Română

