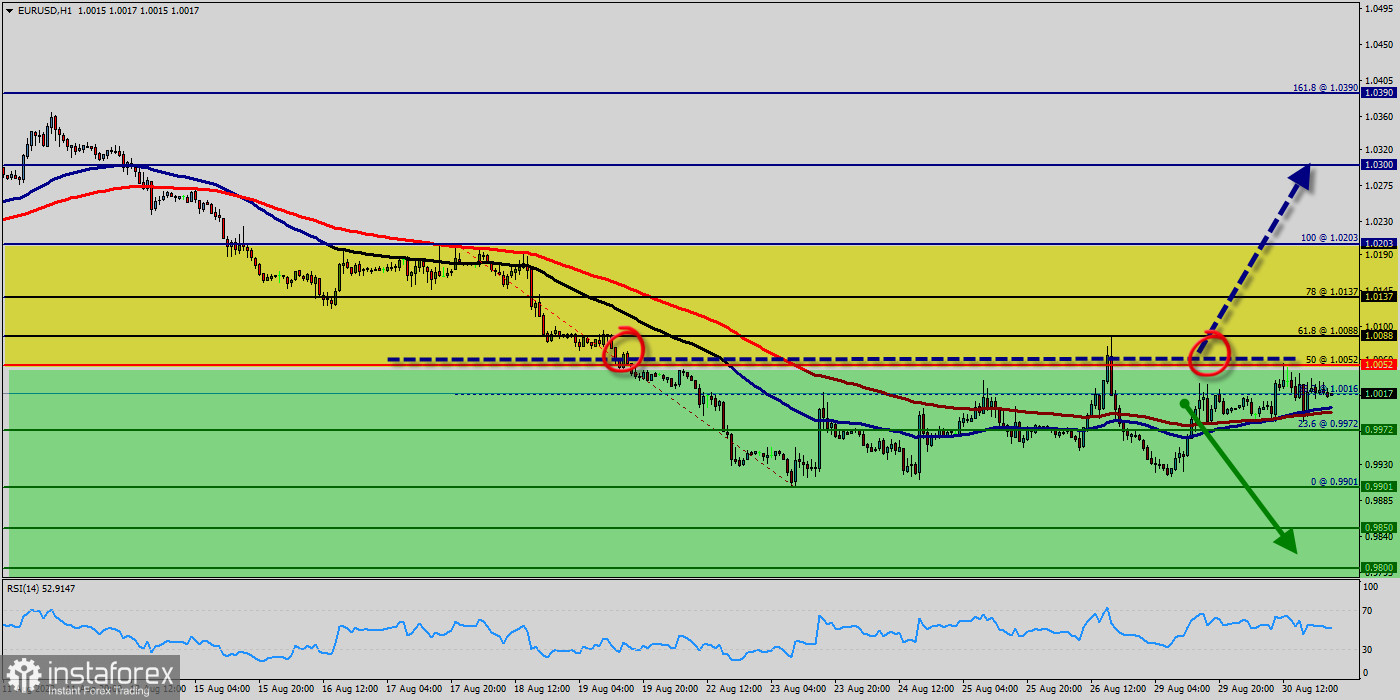
Pivot : 1.0052
The Euro hovered below parity with the dollar, changing hands at around 0.9901 for the first time in 20 years on Thursday, dragged down by recessionary fears and a bigger discrepancy between the ECB and the Fed. Today, the EUR/USD pair has rebounded from the bottom of 0.9953 to set at the price of 1.0044 on the hourly chart. The EUR/USD pair hints at a bearish breakout, as technical indicator (RIS) has resumed their declines within oversold levels, reaching fresh multi-month lows. Moving averages (50 and 100) in the mentioned time frame maintain their firmly downward slopes far above the current level, supporting the bearish case from the levels of 1.0190 and 1.0071. Right now, the EUR/USD pair has been the most sought after forex pair globally and the first choice of almost every forex trader. Combining the top two most traded currencies in foreign exchange market, it becomes essential for a forex trader to have a crystal clear understanding about the EUR/USD Forecast. Currency pair Euro/Dollar continues to move as part of the fall and the downward channel. Moving averages indicate the presence of a short-term bearish trend for the pair. Prices have broken through the area between the signal lines down, which indicates pressure from sellers of the European currency and a potential continuation of the fall in asset quotes already from current levels. At the time of the publication of the forecast, the EUR/USD exchange rate is 1.0044 (key level). The potential target of such a movement on the pair is the area below the level of 1.0044. The risk is also skewed to the downside in the near term and according to the 1-hour chart. Sellers keep rejecting advances around a bearish 100 EMA, currently at around 1.0071 and 1.0044. The Momentum indicator is flat just below its 100 level, but the RSI resumed its slide and approaches oversold readings. The EUR/USD pair has faced strong resistances at the levels of 1.0071 because support had become resistance on July 15, 2022. So, the strong resistance has been already formed at the level of 1.0071 and the pair is likely to try to approach it in order to test it again. However, if the pair fails to pass through the level of 1.0071, the market will indicate a bearish opportunity below the new strong resistance level of 1.0071 (the level of 1.0071 coincides with a ratio of 50% Fibonacci). The level of 1.0071 coincides with 50% of Fibonacci, which is expected to act as major resistance today. Since the trend is below the 50% Fibonacci level, the market is still in a downtrend. Moreover, the RSI starts signaling a downward trend, as the trend is still showing strength above the moving average (100) and (50). Thus, the market is indicating a bearish opportunity below 1.0071, for that it will be good to sell at 1.0071 with the first target of 0.9965. It will also call for a downtrend in order to continue towards 1.0000. The daily strong support is seen at 0.9953. Next objective probably will set at 0.9900. On the other hand, the stop loss should always be taken into account, for that it will be reasonable to set your stop loss at the level of 1.0190. English
 Русский
 Bahasa Indonesia
 Bahasa Malay
 ไทย
ไทย Español
 Deutsch
 Български
 Français
 Tiếng Việt
 中文
中文 বাংলা
বাংলা हिन्दी
 Čeština
 Українська
 Română

