After consolidating the whole previous week, bitcoin made a huge jump and rose to $47,500 during the weekend. In just a few hours, bitcoin gained $3,000 and continued its bullish rally, which initially surprised the market. At the end of the weekend, BTC approached the important resistance level located at $48,000 and stopped there. At the same time, bitcoin's network activity continues to grow and major players are increasing the rate of coin accumulation. All above indicates bitcoin's bullish rally and price growth. However, in order to predict the next period of growth of the quotes, it is necessary to use technical indicators that show the potential trend of the price.
On-chain activity is the activity of cryptocurrency market players who independently dispose of their crypto-assets, making the record go directly to the main blockchain. This statistic includes both individual investors and large companies.
Price consolidation is a period when a certain cryptocurrency is trading within a narrow horizontal price channel.
The Relative Strength Index (RSI) is a technical indicator that shows the strength of the trend (downward or upward) and alerts you to possible reversals in the price trend. This metric is used to evaluate overbought or oversold conditions in the price of an asset. The optimal reading for the indicator is 60 if we consider a bullish trend. It indicates a high demand for the asset and the strength of the current upward momentum. If the asset exceeds this reading, it steps into an overbought zone.
MACD (Moving Average Convergence/Divergence Index) is an indicator that helps draw certain conclusions about the trend based on the moving averages and finding metric values between them. The usual bullish signal is when the white line crosses under the red line and the bearish signal, on the contrary, when the white line from above crosses the red line, indicating a downward movement.
The stochastic (stochastic oscillator) indicates the strength of the momentum of the current prevailing trend. If the indicator's reading is above 80, the asset can be considered overbought, but if the stochastic is below 20, it is a signal that the asset is oversold.
The most convenient tools to determine the further bitcoin price trend are technical indicators on horizontal charts. Over the past 24 hours, BTC remained almost unchanged in price and is trading near the $48,000 where the resistance is located. This suggests that as of 3:00 pm, the asset has exhausted its bullish momentum that was seen since Friday. The main factor for this is the achievement of the resistance level, which prevents the price from going up. The absence of a visible drop or a rise indicates a local pause and consolidation. Bitcoin has risen sharply enough, and the coin is stabilizing to avoid sudden price changes. At the same time, the main market participants continue to buy the available volumes of coins on exchanges, thus eliminating additional pressure on the price. That is, we are watching a consolidation and price stabilization, which is likely to be followed by the rapid growth of bitcoin quotes.
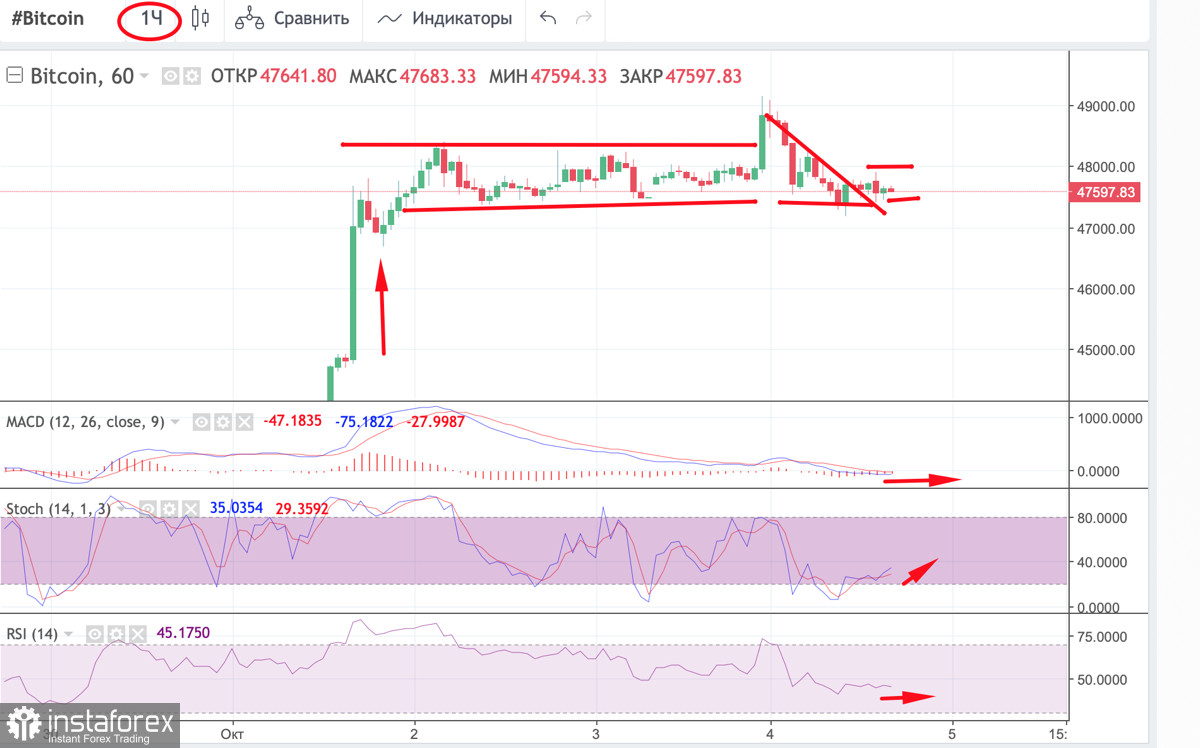
The current situation is ideal to analyze the BTC technical indicators to predict the further trend pattern. Let's start with the hourly chart, where sideways price movement is seen and a bearish triangle pattern was formed. Bitcoin was trading in a narrow range, after which bulls tried to push the price higher, but encountered increased resistance, which resulted in the formation of a triangle promising a price decline. However, the bearish pattern was broken. After that, the price went up again and resumed its consolidation. Notably, the technical indicators do not show a unified picture of what is happening to the trend. The MACD indicator is oscillating in the red area along with the zero level, which signs an absence of bullish momentum. The RSI shows a similar trend, which is located at the level of 45 and is oscillating near it. The stochastic oscillator, on the contrary, formed a bullish cross and is moving towards the 60 mark, and may break the narrow fluctuation range. However, we need to analyze other charts to confirm this.

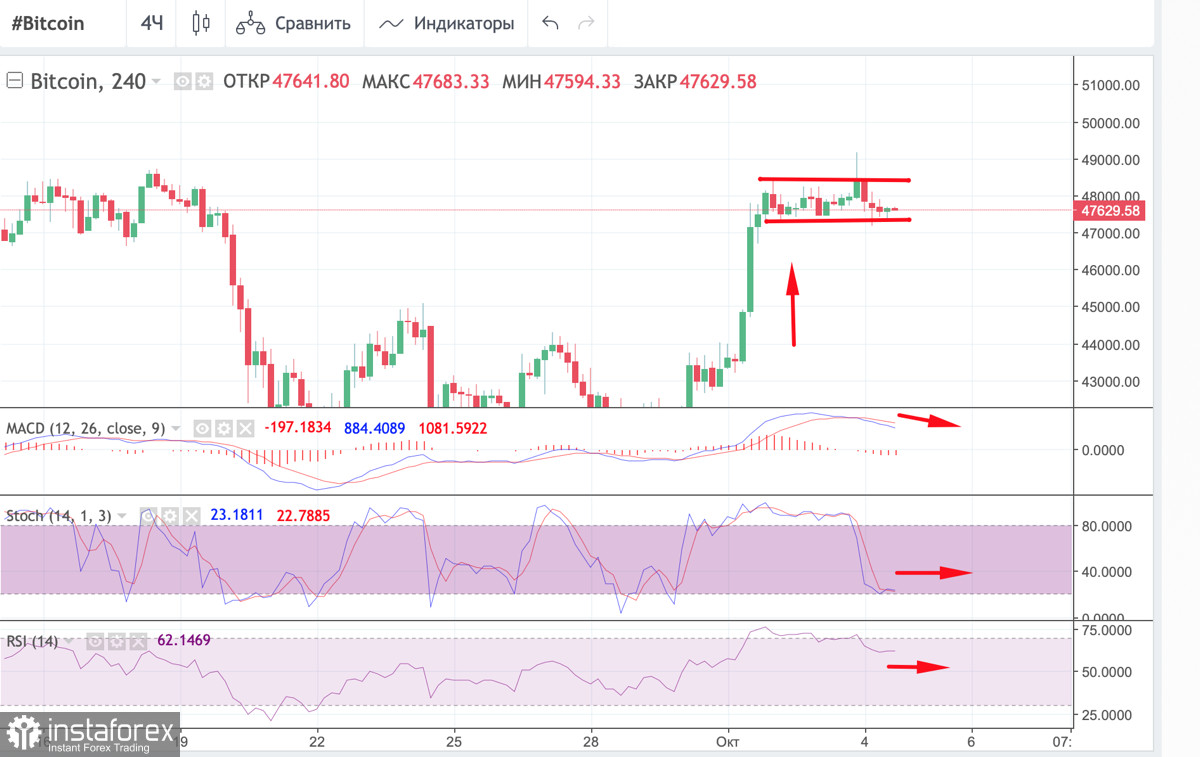
On the 4-hour chart, there are no signs of new upward momentum. On the contrary, indicators declined after the bullish rally and are beginning to stabilize, which reflects what is happening on bitcoin charts. The MACD indicator begins to decline after forming a bullish crossover, failing to make an upward momentum. The stochastic oscillator was declining, but eventually, it managed to make a reversal and is now moving sideways, indicating recovery and a lack of market players' action. The RSI fell to the safe reading located at 65 and is moving along it. Overall, the situation reflects an accumulation and a recovery of indicators after a long growth. At the same time, there are visible prerequisites for the continuation of the upward trend, which should be confirmed on the daily chart.

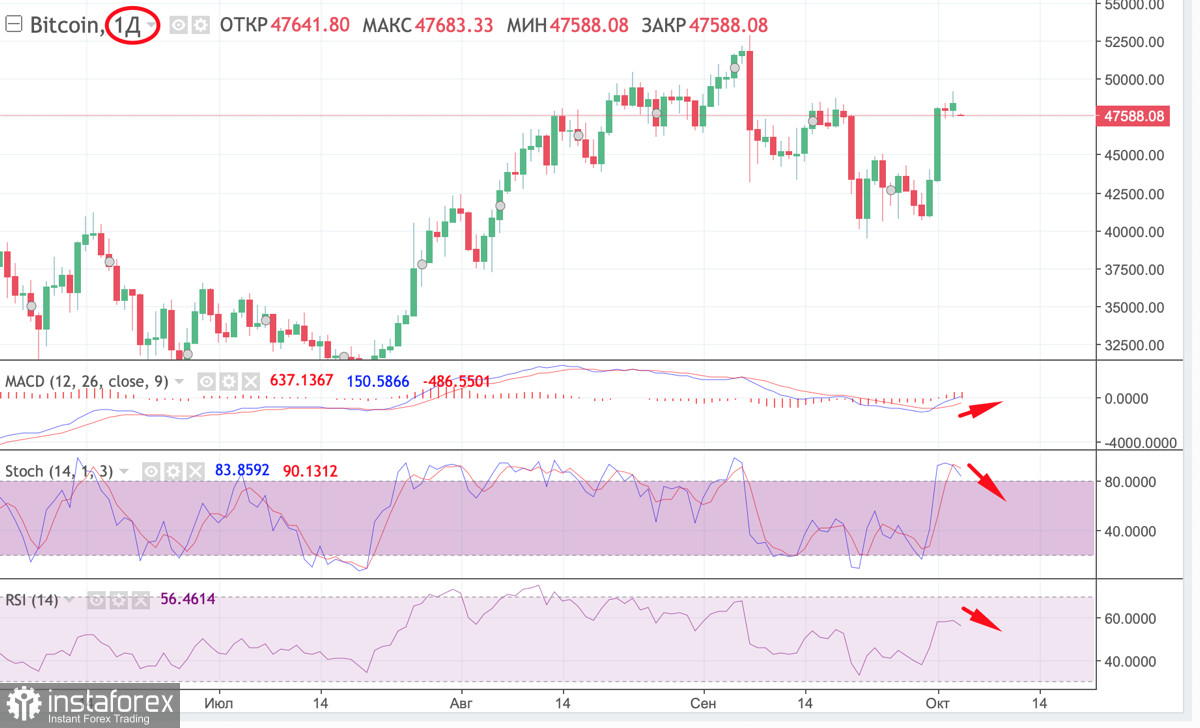
Finally, the indicators of bitcoin's daily chart represent a conclusion of all previous analyses, where there are no unified dynamics of the price trend. We can see the inconsistency and weakness of new attempts to develop a bullish momentum, which allowed BTC to reach $47,500. The MACD indicator has formed a bullish crossover, but it is moving sideways in the red area with no signs of breaking through the zero level. The stochastic oscillator and the RSI indicator lost their upward momentum and continue to decline below the level of 60. Despite local signals of weakening, the price may rise sharply, but if the market situation remains stable, bitcoin is likely to continue its recovery within a narrow range for at least one more day. The daily chart helps to monitor the possible breakout of this range, and, most likely, it will happen at the end of the current trading day.

 English
 Русский
 Bahasa Indonesia
 Bahasa Malay
 ไทย
ไทย Español
 Deutsch
 Български
 Français
 Tiếng Việt
 中文
中文 বাংলা
বাংলা हिन्दी
 Čeština
 Українська
 Română

