Hello, dear traders!
Like many other currencies (except for the loonie and the aussie), the pound sterling was falling versus the greenback in the previous week. As a result, GBP/USD lost 0.84%. An increase in demand for USD came amid a surge in new COVID-19 cases, higher bond yields, as well as the possibility of a shutdown in the US. I assume that the US debt limit, as well as a rising coronavirus rate, will remain the center of attention this week. These factors are likely to provide support to the greenback as a safe-haven asset. So far, let's analyze the results of the previous week and the weekly chart in GBP/USD.
Weekly chart

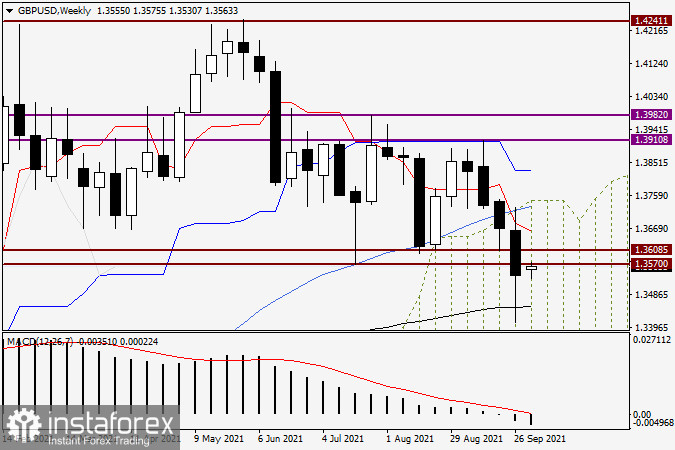
All in all, there is a twofold situation in the weekly time frame. On the one hand, there is a bearish candlestick with a close below the key support level of 1.3570. On the other hand, there is a long lower shadow, indicating the unlikelihood of a further bearish move. Besides, a strong EMA 200 is located at 1.3374. It may reverse the pair. Under such circumstances, it is always challenging to forecast where the price will go next because of mixed signals. In this light, let's consider two possible scenarios. Thus, if the bearish trend extends and the quote reaches the low of 1.3410, the pair is likely to test the level of 1.3400 and even head towards the EMA 200.
In case of a breakout at the EMA 200 and the weekly close below it, the market is expected to be bearish. At the same time, do not forget about another important mark – 1.3500. In the previous week, the price closed at 1.3540, meaning that sellers will attempt to push the pair below 1.3500 and consolidate there. After that, the quote may fall to its latest lows and test the 1.3400 level. For the market to become bearish, the price should rise to the red Tenkan Sen, go above it, and break the MA 50, as well as the upper boundary of the Ichimoku Cloud near 1.3730.
Daily chart

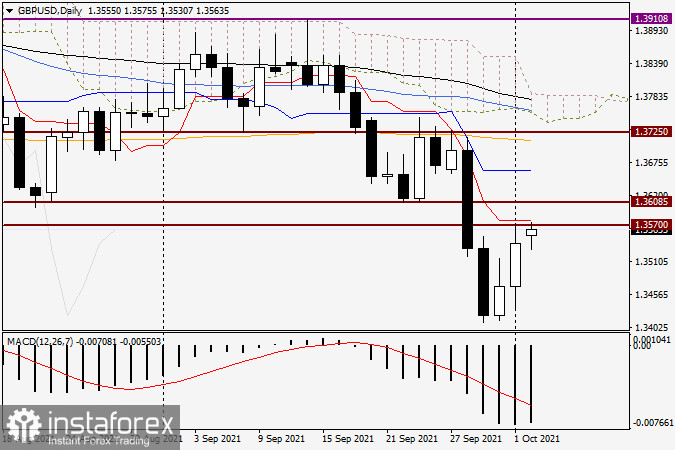
According to the daily chart, the market was bullish at the end of the previous week. Within the past two days, the pair was rising. However, this upward trajectory should be considered as a correction. At the moment, the price is moving towards the broken support level of 1.3570, which currently acts as a strong resistance. This is confirmed by the red Tenkan Sen, passing slightly above the barrier. Let's see how the price behaves near 1.3570.
In case the price closes below this mark, it will give a sell signal. If the quote closes above 1.3570 and the Tenkan Sen line on Monday, it will make us think whether it has been a true breakout. Tomorrow, taking into account the close of trading and the closing price of today's daily candle, we will make specific trading decisions. Moreover, we will look at lower time frames. At the moment, I suggest it is wise to sell the pair.
Have a nice trading day!
 English
 Русский
 Bahasa Indonesia
 Bahasa Malay
 ไทย
ไทย Español
 Deutsch
 Български
 Français
 Tiếng Việt
 中文
中文 বাংলা
বাংলা हिन्दी
 Čeština
 Українська
 Română

