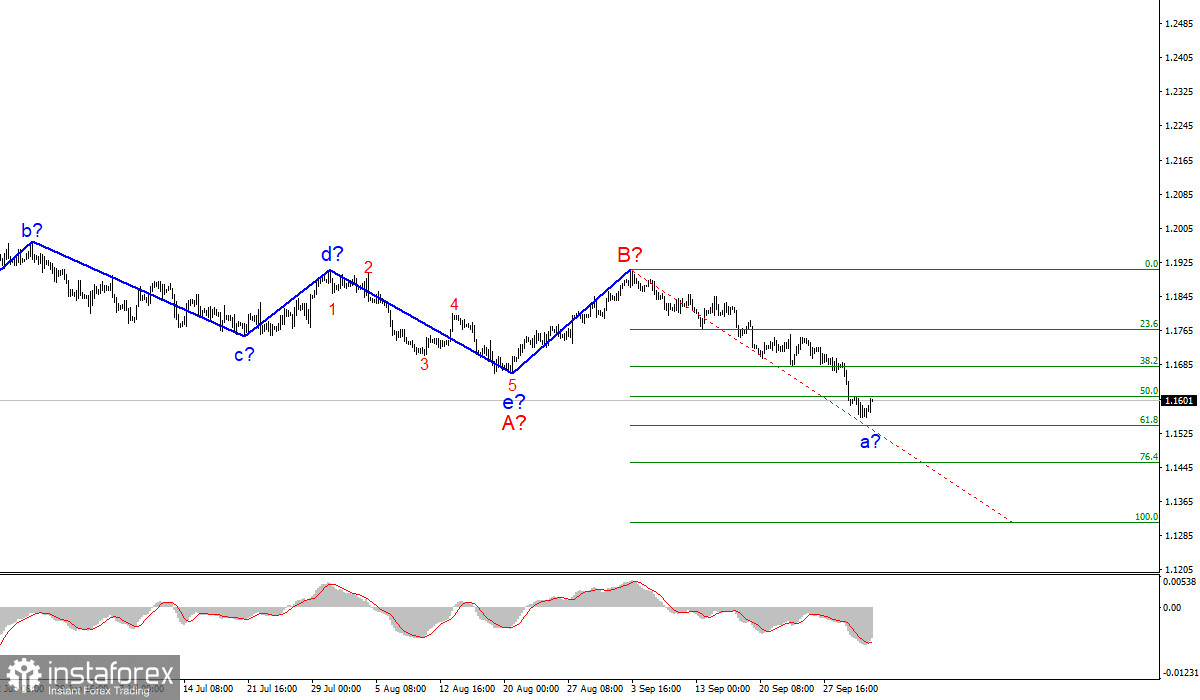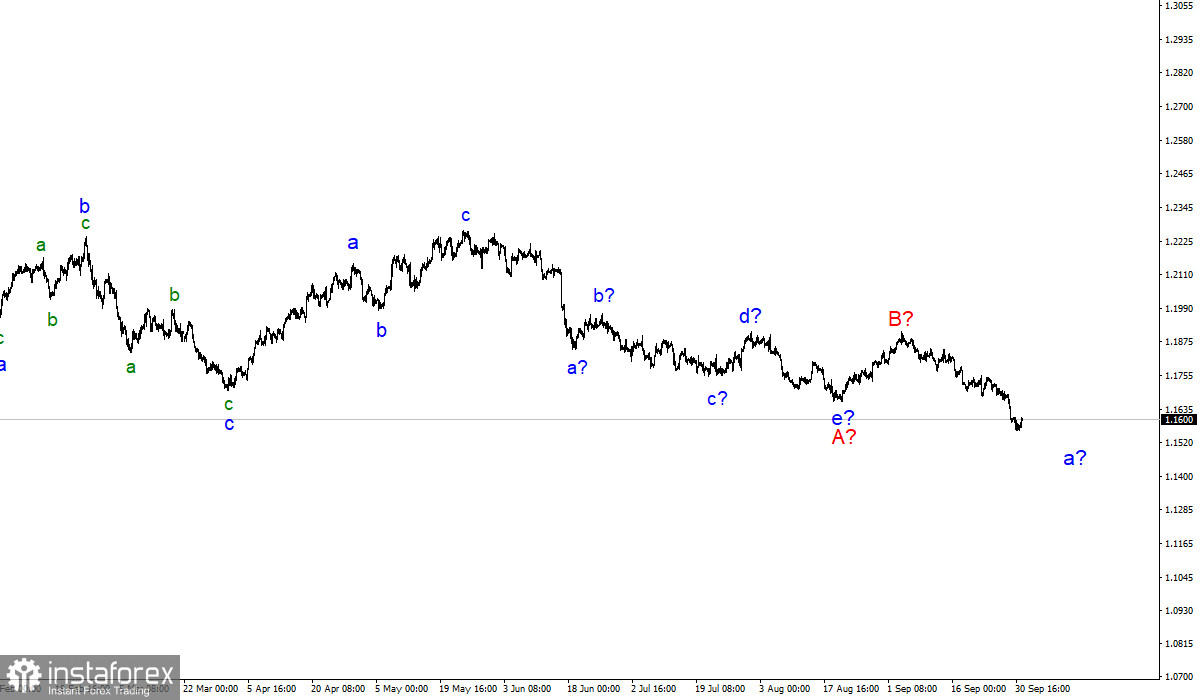
The wave counting of the 4-hour chart for the EUR/USD has undergone certain changes. After the quotes fell below the low of the previous wave, it became clear that the construction of the downward trend section is resumed. Consequently, it was necessary to make such adjustments that would involve a section of the a-b-c-d-e trend, which was formed from the very beginning of the year. I believe that this section can be considered wave A, and the subsequent increase can be considered wave B. If this is indeed the case, then the construction of the proposed wave C has now begun, which can take a very extended form, given the size of wave A. At the same time, the entire section of the trend may again take a corrective, three-wave form A-B-C. Thus, the probability of further reduction of the instrument has increased dramatically. A successful attempt to break through the 1.1612 mark, which corresponds to 50.0% Fibonacci level, indicates the readiness of the markets for new sales. Nevertheless, at this time, the construction of the proposed wave b can begin.
Throughout the week, Janet Yellen, Christine Lagarde, and Jerome Powell gave speeches almost every day. But despite the fact that the euro has declined by 130 basis points this week, I cannot conclude that it was somehow influenced by these numerous speeches. The news background on Friday was on the side of the euro, but the amplitude that the instrument showed during the day is very weak – only 20 basis points. Based on the released data, European Union's manufacturing PMI for September almost completely coincided with market expectations. Meanwhile, the consumer price index for September slightly exceeded expectations at 3.4% YoY. Thus, inflation in the EU continues to accelerate, and the markets associate this process with an increase in the probability of a decrease in the volume of asset purchases by the central banks of the Eurozone.
However, ECB President Christine Lagarde, just this week said several times that strong inflation is temporary and will decline in the future. The ECB does not expect inflation above the 2% target. However, until it starts to decline, it can continue to grow. The situation in the United States is about the same, with the only difference being that the Fed is already determined to start tapering the stimulus program. And it will most likely happen in November. Thus, the dollar may have market support based on this factor. However, Lagarde also said at the last ECB meeting that, in the third and fourth quarters, the volume of asset purchases will be reduced, which can be regarded in the same way as QE tapering.
Based on the analysis, I conclude that the construction of the downward wave C will continue for some time. Therefore, now I advise selling the instrument for each downward signal from the MACD with targets located near the calculated marks of 1.1608 and 1.1540, which corresponds to 50.0% and 61.8% Fibonacci levels. The proposed wave C may turn out to be approximately the same size as wave A. At the same time, the quotes may continue to rise within the framework of the expected wave b for some time.

The wave counting of the higher scale looks quite convincing. The decline in quotes continues and now the downward section of the trend, which originates on May 25, takes the form of a three-wave corrective structure A-B-C. Thus, the decline may continue for several more months until wave C is fully completed.
 English
 Русский
 Bahasa Indonesia
 Bahasa Malay
 ไทย
ไทย Español
 Deutsch
 Български
 Français
 Tiếng Việt
 中文
中文 বাংলা
বাংলা हिन्दी
 Čeština
 Українська
 Română

