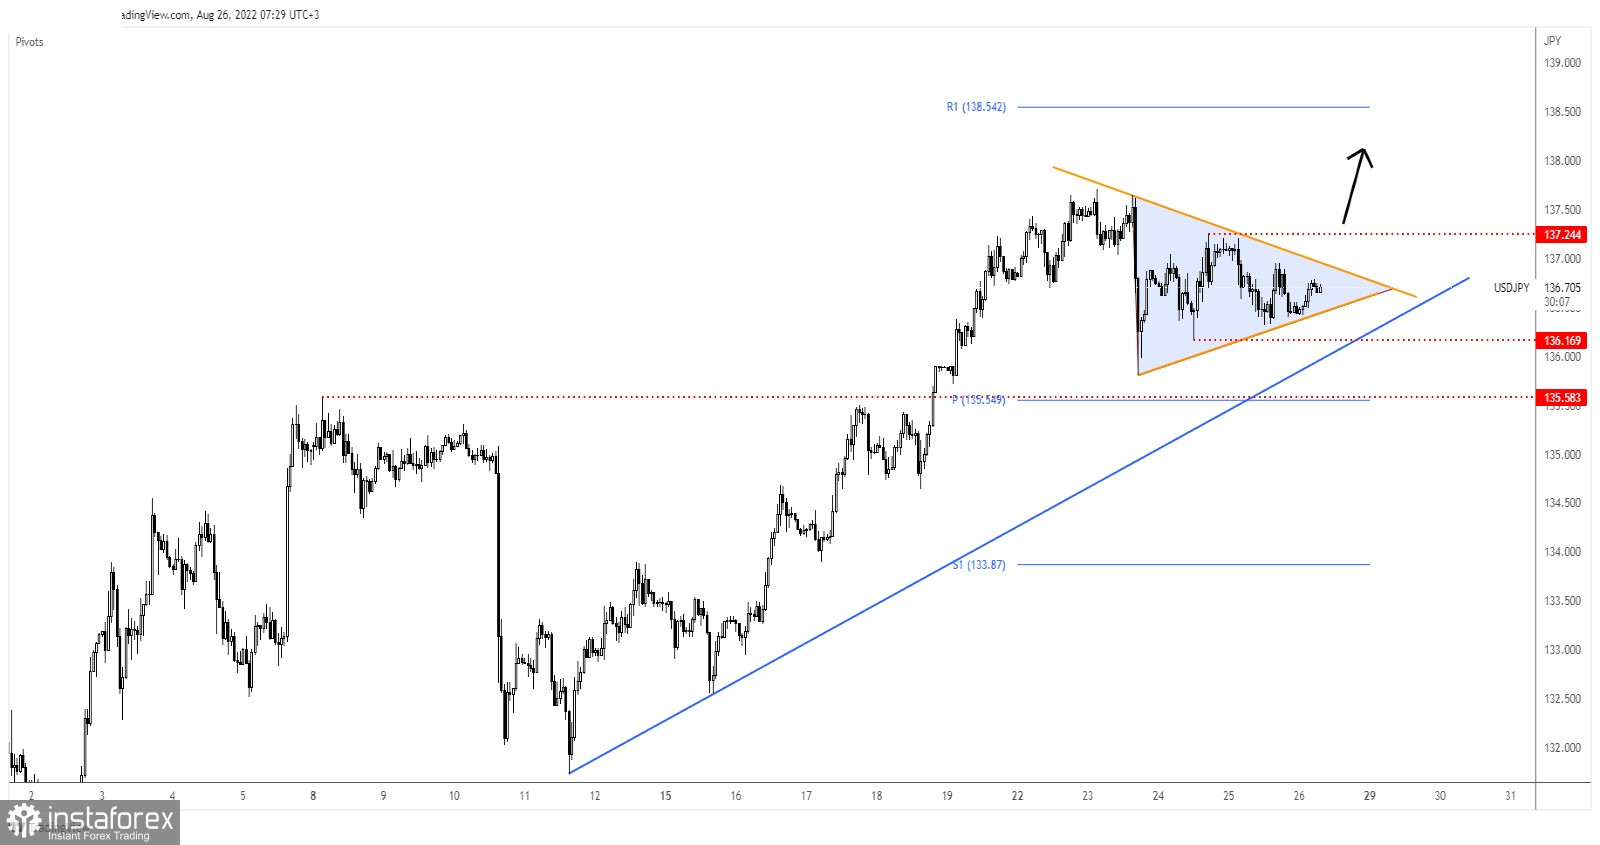
The USD/JPY pair continues to move sideways in the short term. Technically, the price tries to accumulate more bullish energy before resuming its growth. The bias is bullish, so further growth is on the cards.
It was traded at 136.71 at the time of writing. A temporary retreat was natural after its amazing rally. Fundamentally, the Tokio Core CPI rose by 2.6% beating the forecast of 2.5%. Later, the US is to release the Core PCE Price Index which is expected to report a 0.2% growth, while Fed Chair Powell's remarks about the economic outlook at the Jackson Hole Economic Symposium could really shake the markets.
USD/JPY Triangle

From the technical point of view, the bias is bullish as long as the pair stays above the uptrend line. The price developed a symmetrical triangle which could represent an upside continuation formation.
It is trapped between the 136.16 and 137.24 levels. Escaping from this pattern could bring new trading opportunities.
USD/JPY Forecast
A valid breakout above the triangle's resistance and through 137.24 could activate further growth. This could be seen as a buying opportunity. Also, a new higher high could confirm more gains ahead.
 English
 Русский
 Bahasa Indonesia
 Bahasa Malay
 ไทย
ไทย Español
 Deutsch
 Български
 Français
 Tiếng Việt
 中文
中文 বাংলা
বাংলা हिन्दी
 Čeština
 Українська
 Română

