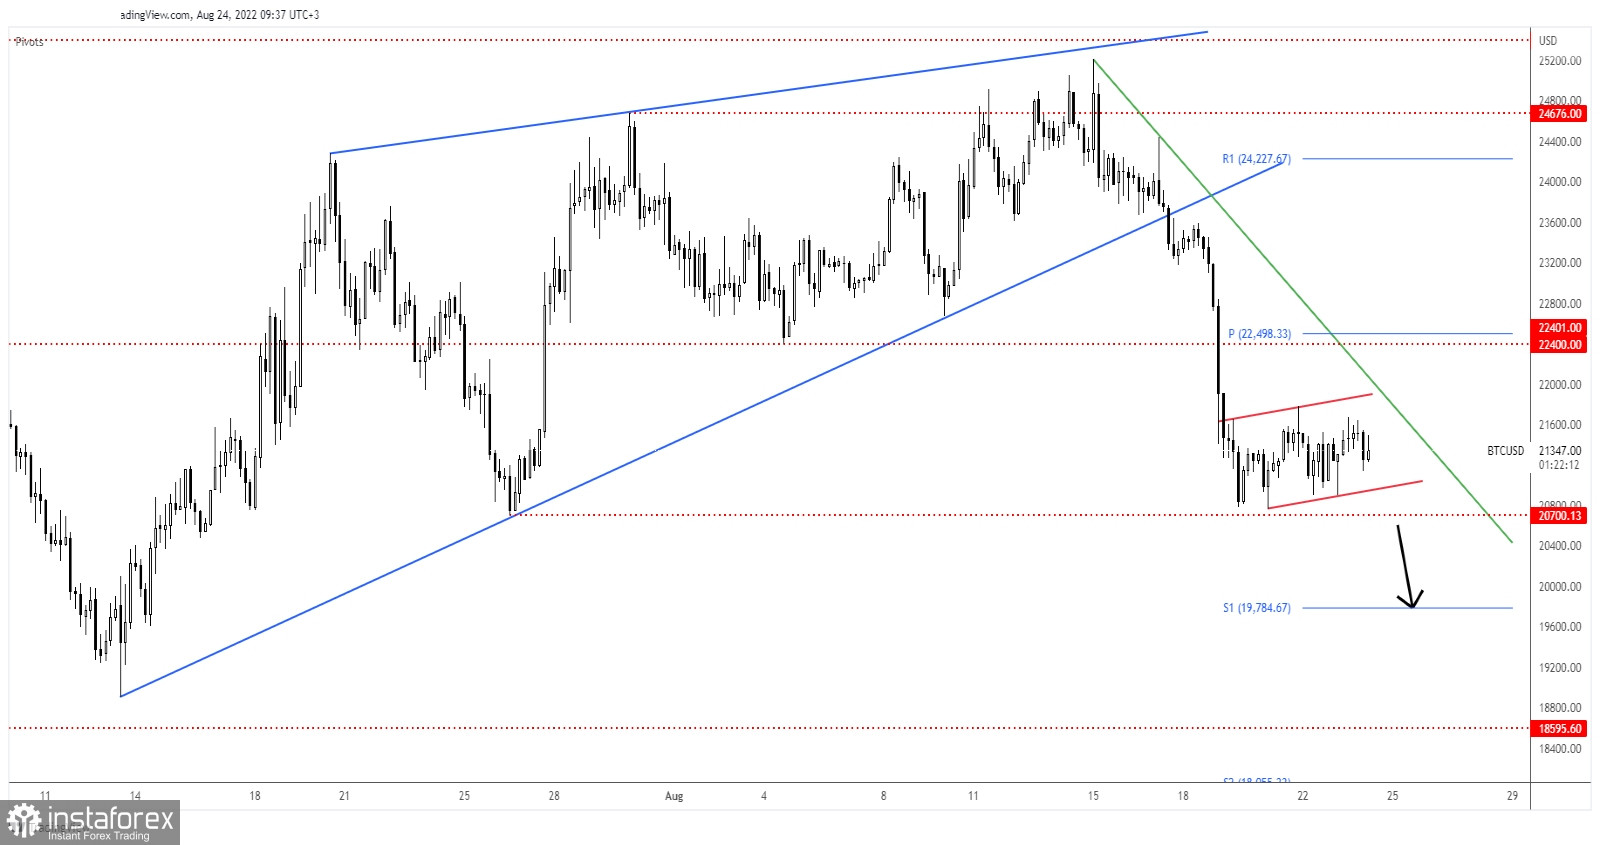
The price of Bitcoin is fighting hard to rebound after its massive drop. BTC/USD was traded at 21,448 at the time of writing. Technically, the price action developed a bearish continuation pattern. Still, we need strong confirmation before taking action.
BTC/USD dropped by 17,62% from last week's high of 25,212 to a new low of 20,769. In the last 24 hours, Bitcoin has gone up by 2.08% but it has lost 11.72% in the last 7 days.
BTC/USD Flag Formation

BTC/USD developed a minor ascending channel pattern, a flag formation that could activate more declines as long as it stays under the downtrend line. The 20,700 key level is seen as a downside obstacle.
After escaping from the Rising Wedge pattern, Bitcoin was expected to drop. Temporary rebounds could bring new short opportunities.
BTC/USD Forecast
Staying below the downtrend line and making a valid breakdown below 20,700 may activate more declines. This scenario could bring new short opportunities.
 English
 Русский
 Bahasa Indonesia
 Bahasa Malay
 ไทย
ไทย Español
 Deutsch
 Български
 Français
 Tiếng Việt
 中文
中文 বাংলা
বাংলা हिन्दी
 Čeština
 Українська
 Română

