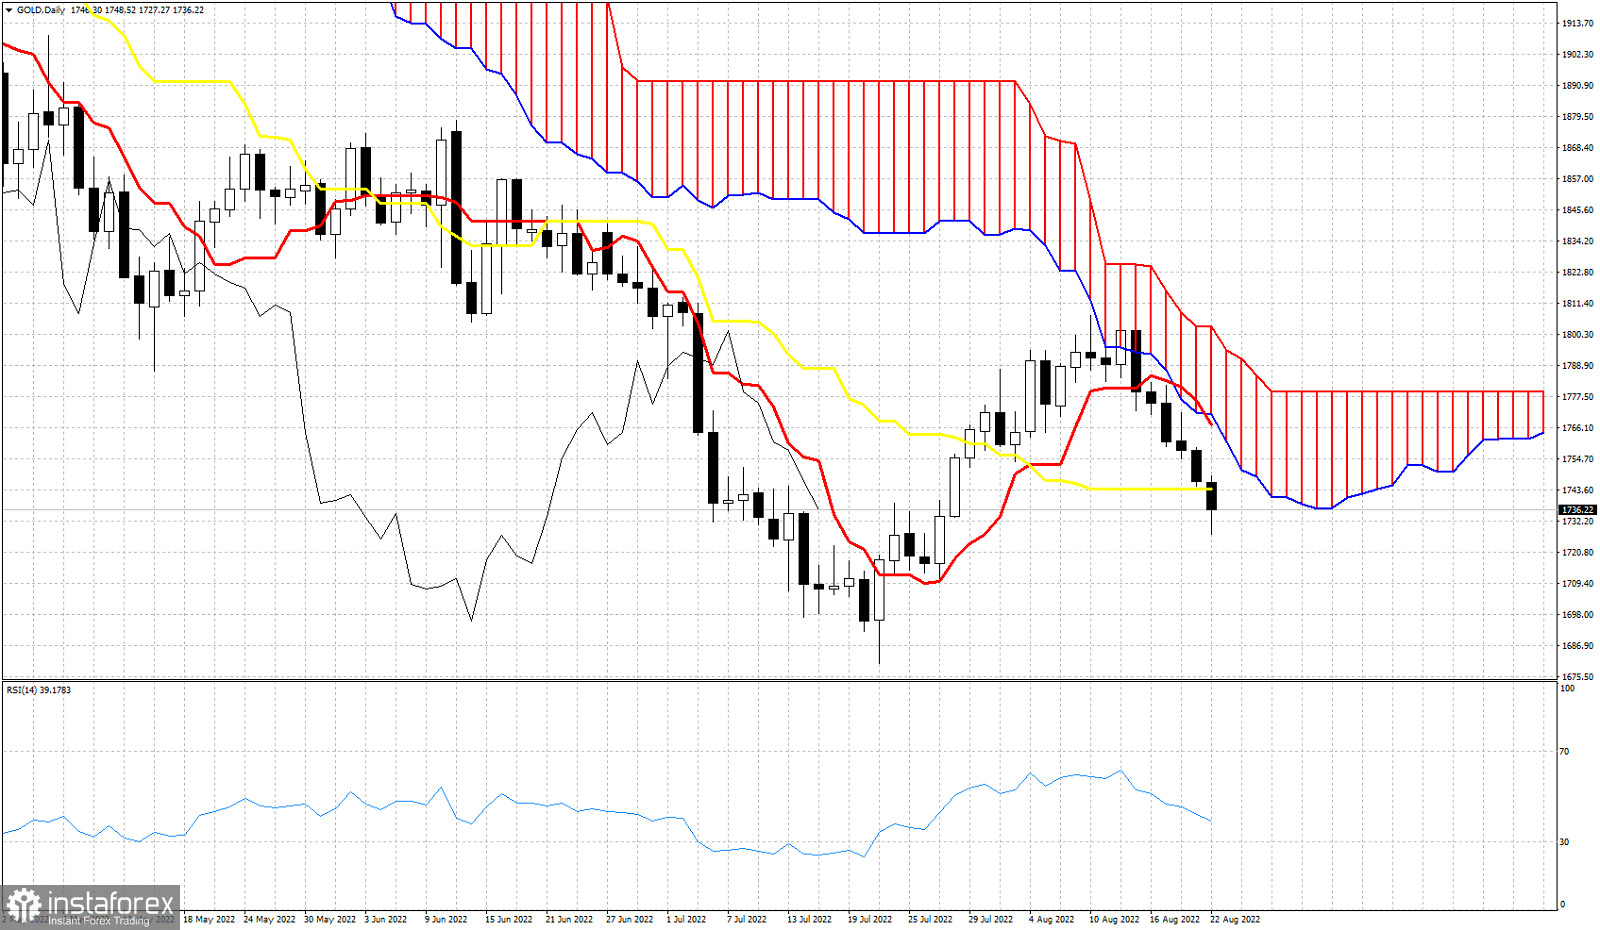
Gold price has started the week under pressure, exactly the way it ended last week. Price has broken below $1,740 and price is now trading below the Daily Kijun-sen (yellow line indicator). Gold price remains vulnerable to more downside. Gold remains below the Daily Kumo (cloud). Trend remains bearish according to the Ichimoku cloud indicator. Price got rejected last week at the cloud resistance and is breaking support levels since then. First price broke the tenkan-sen (Red line indicator) and today is breaking below the kijun-sen. As long as price remains below the Kumo, bears will remain in control of the trend. Resistance by the cloud is at $1,770. Gold as expected at $1,800 is pulling back down. Our first target of $1,750 was achieved and now our second target of $1,729 was also achieved a couple hours earlier. Price has also retraced 61.8% of the entire upward movement. The 61.8% retracement level is a key Fibonacci level where we usually see trend reversals. If bulls manage to defend $1,729 we could see at least a short-term bounce higher. Failure to hold above $1,729 will bring Gold price towards $1,711.
 English
 Русский
 Bahasa Indonesia
 Bahasa Malay
 ไทย
ไทย Español
 Deutsch
 Български
 Français
 Tiếng Việt
 中文
中文 বাংলা
বাংলা हिन्दी
 Čeština
 Українська
 Română

