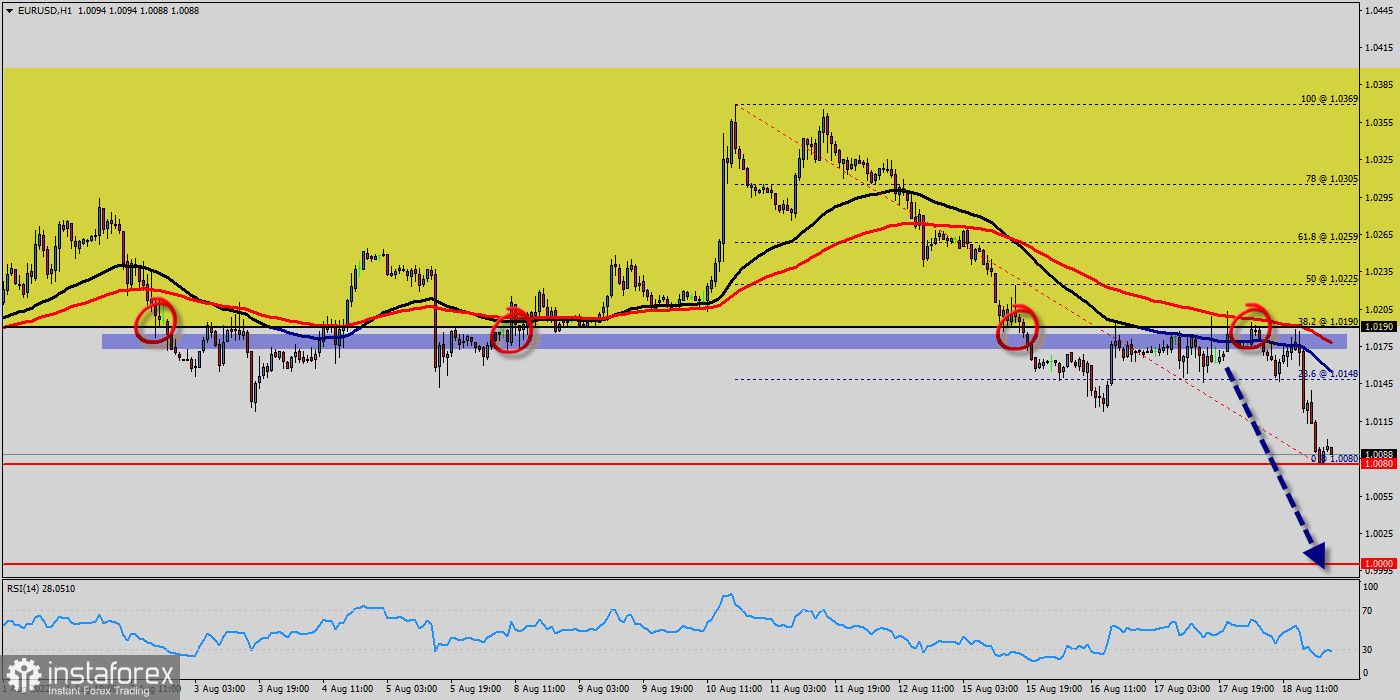
Euro parity still in play ahead of decisive US inflation data, for that common currency came within whisker of $1 (1.0080 - right now).
Right now, the EUR/USD pair is still moving around the price of 1.0080. The currency pair EUR/USD is trading below the resistance level of 1.0190.
The euro to US dollar (EUR/USD) rate has fallen about 3% year-to-date to trade around 1.0000. The decline is comparable to losses last seen for seven years, when the European Central Bank unleashed its massive stimulus programme.
The EUR/USD pair continues to move downwards from the level of 1.0190, which represents the double top in the hourly chart.
Yesterday, the pair dropped from the level of 1.0190 to the bottom around 1.0080. Today, the first resistance level is seen at 1.0190 followed by 1.0225, while daily support is seen at the levels of 1.0080 and $1.
According to the previous events, the EUR/USD pair is still trading between the levels of 1.0190 and 1.0000. Hence, we expect a range of 146 pips in coming hours (1.0190 - 1.0000).
The first resistance stands at the price of 1.0190, therefore if the EUR/USD pair fails to break through the resistance level of 1.0190, the market will decline further to 1.0050. This would suggest a bearish market because the RSI indicator is still in a negative area and does not show any trend-reversal signs. The pair is expected to drop lower towards at least 1.0050 in order to test the second support ($1).
The US Dollar and the Euro are two of the most prominent and well-known currencies in the world. The Euro versus US Dollar (EUR/USD) currency pair has the largest global trading volume, meaning it is the world's most-traded currency pair. Whether you find the instrument easy or difficult to trade on, it's not a pair that many traders neglect, due to its daily volatility and price movement.
Conclusion :
Downtrend scenario :
On the downside, the 1.0190 level represents resistance. The next major resistance is located near the 1.0190, which the price may drift below towards the 1.0190 resistance region. The breakdown of 1.0080 will allow the pair to go further down to the prices of 1.0050 and $1.
 English
 Русский
 Bahasa Indonesia
 Bahasa Malay
 ไทย
ไทย Español
 Deutsch
 Български
 Français
 Tiếng Việt
 中文
中文 বাংলা
বাংলা हिन्दी
 Čeština
 Українська
 Română

