Yesterday, gold accelerated its fall due to the increase in the US Treasury yields. The 10-year Treasury bond yield hit a high of 2.916%. Since gold is inversely correlated with bonds, market sentiment is expected to weaken and gold could fall in the coming days.
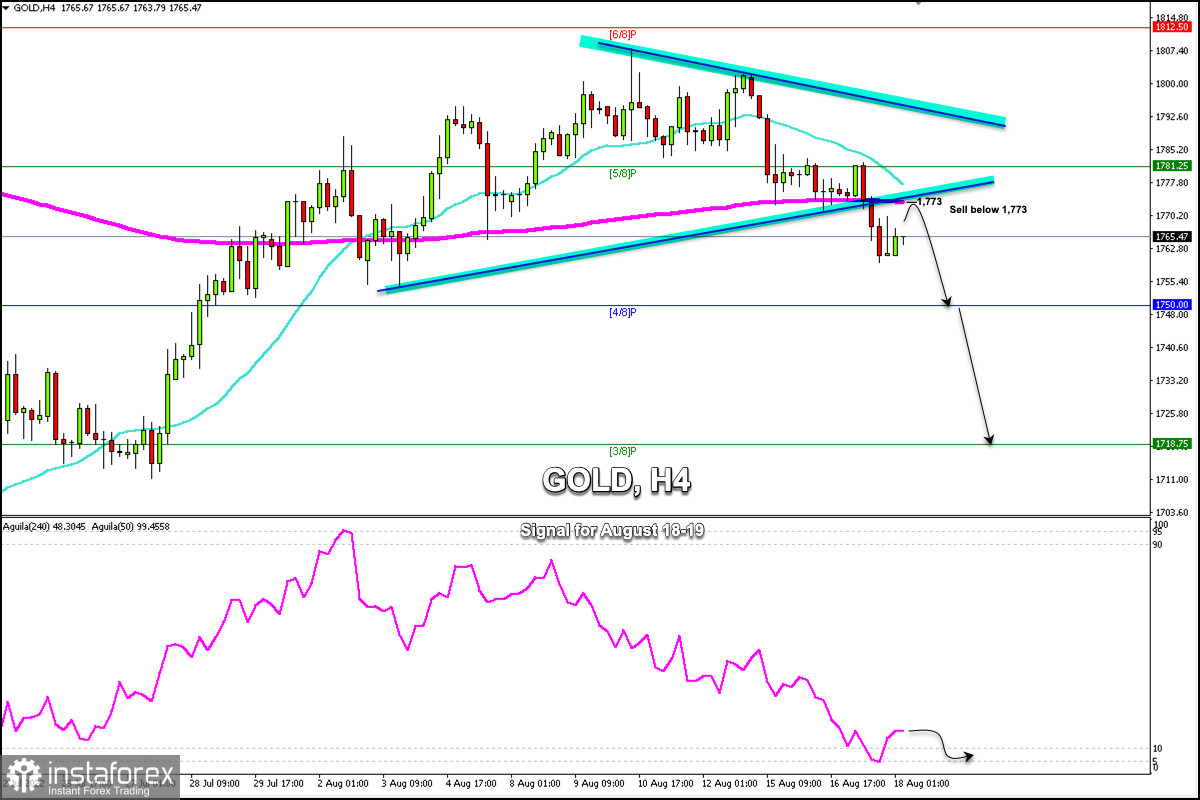
The outlook according to the 4-hour chart is targeting the downside. XAU/USD is developing a decline below 21 SMA and 200 EMA, while the eagle indicator has reached oversold levels and a technical bounce is likely in the coming hours.
XAU/USD on the daily chart shows that gold remains under bearish pressure below 6/8 Murray (1,812) and below the psychological level of 1,800. Market sentiment will be more cautious and investors are likely to take refuge in the dollar due to the fact that the Fed will increase its interest rate in September.
According to the 4-hour chart, we can see the formation of a symmetrical triangle. The break seen on the chart below the 200 EMA could be a clear sign that gold could resume its downtrend and could reach the support of 4/8 Murray located at 1,750.
On the contrary, if XAU/USD consolidates above 1,781 (5/8 Murray), we could expect the bullish cycle to resume and it could reach 1,790, 1,800, 1,812.
In the next few hours, we expect a pullback towards the resistance zone of 200 EMA located at 1,773 or towards the top of the triangle. In case it fails to consolidate above 1,777, it will be a clear signal to sell it and the price could reach the support of 3/8 Murray at 1,718 in the short term.
Our trading plan for the next few hours is to sell below 1,773 or below 1,777 with targets at 1,750 and 1,718. The eagle indicator is in the negative zone and is likely to continue its downtrend.
 English
 Русский
 Bahasa Indonesia
 Bahasa Malay
 ไทย
ไทย Español
 Deutsch
 Български
 Français
 Tiếng Việt
 中文
中文 বাংলা
বাংলা हिन्दी
 Čeština
 Українська
 Română

