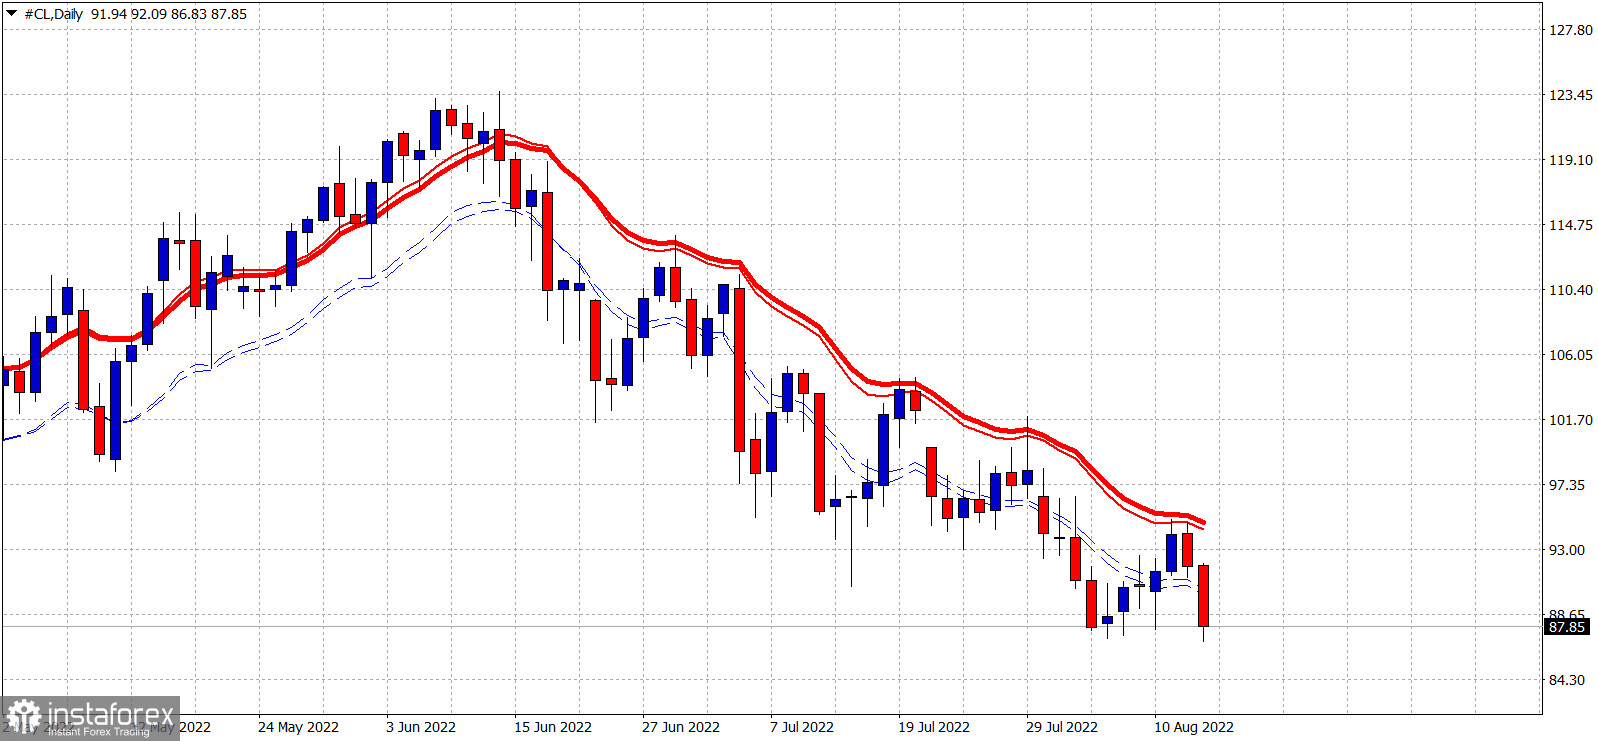
Red lines- exponential moving averages (high)
Blue dotted lines- exponential moving averages (low)
Oil prices are again below $90. Price remains clearly in a bearish trend making lower lows and lower highs since the lower high around $123-$124. Oil prices remain below the red moving average since June 14th and has not broken above them. The red moving averages continue to provide key resistance levels with a negative slope as prices continue to move lower. Recent highs around $94-$95 provide the closest key resistance level. Bulls need to break above this resistance area in order to claim control of the short-term trend.
 English
 Русский
 Bahasa Indonesia
 Bahasa Malay
 ไทย
ไทย Español
 Deutsch
 Български
 Français
 Tiếng Việt
 中文
中文 বাংলা
বাংলা हिन्दी
 Čeština
 Українська
 Română

