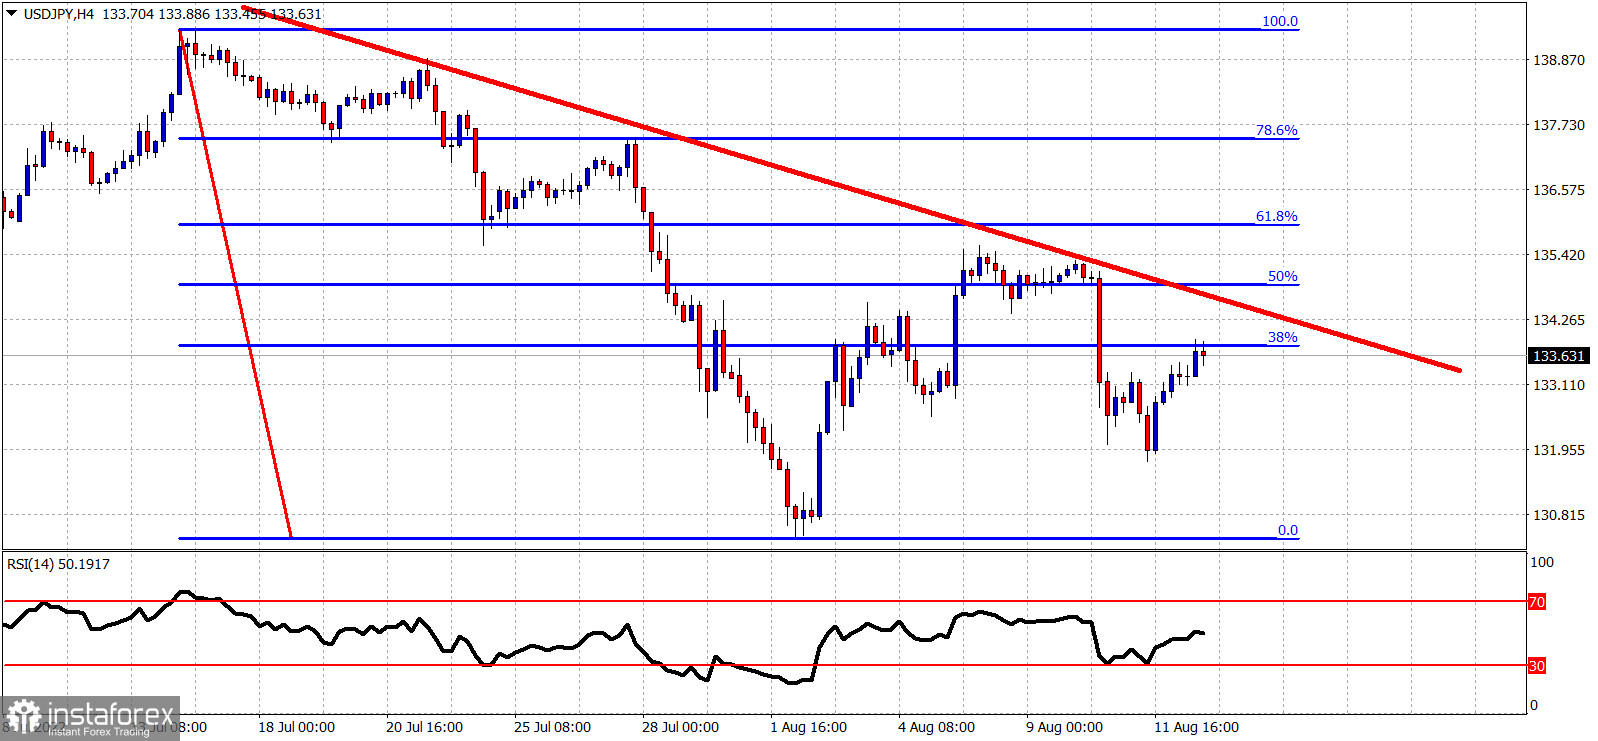
Red line -resistance trend line
Blue lines- Fibonacci retracements
USDJPY is bouncing after making a low at 131.75. The resistance trend line at 134.75 is the most important level for the short-term trend. With price having retraced more than 50% of the decline and rejected at the trend line resistance, it is important to see how strong bulls are. Bulls need to see price break above the red downward sloping trend line. This would provide a sign of strength and will increase chances of price moving towards the 61.8% Fibonacci retracement. Support remains key at recent low of 131.75. Bulls need to defend this level, otherwise if broken, we will see a fast decline towards 130.80 and lower.
 English
 Русский
 Bahasa Indonesia
 Bahasa Malay
 ไทย
ไทย Español
 Deutsch
 Български
 Français
 Tiếng Việt
 中文
中文 বাংলা
বাংলা हिन्दी
 Čeština
 Українська
 Română

