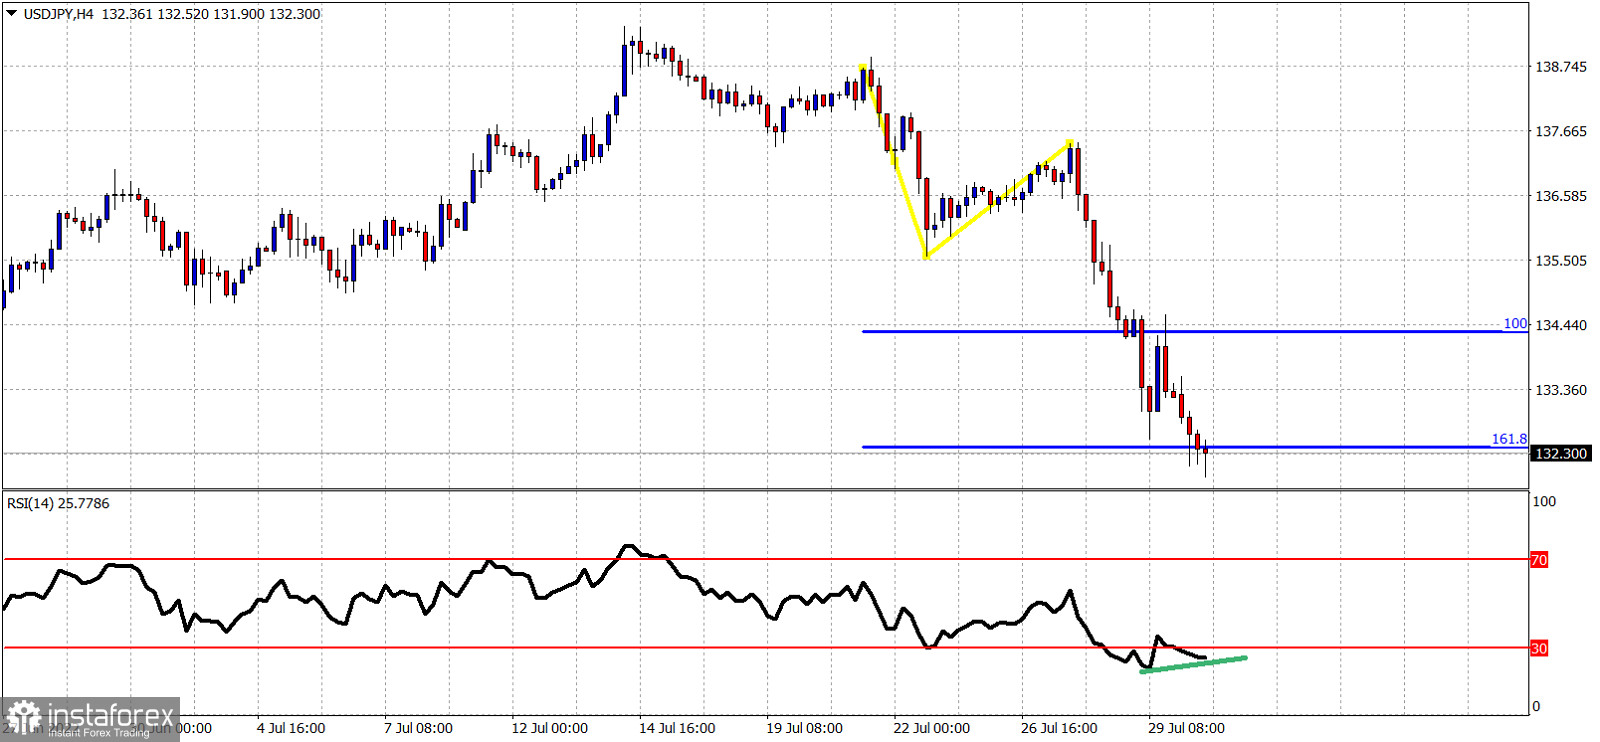
Blue lines- Fibonacci extensions
Green line- bullish RSI Divergence
USDJPY continues trading in a bearish trend making new lower lows and lower highs. Price has reached the 161.8% Fibonacci extension of the previous leg down. The RSI is at oversold levels providing bullish divergence signals. In the 4 hour chart price justifies a strong bounce higher. As we mentioned in a previous analysis, USDJPY July performance was terrible and the monthly candlestick was a bearish reversal one. Our longer-term view remains bearish, expecting a pull back towards 130-126 where we also find the neckline of the inverted head and shoulders pattern. A back test of the neckline is justified. Nevertheless in the near term I believe USDJPY could produce a bounce towards 134-135.
 English
 Русский
 Bahasa Indonesia
 Bahasa Malay
 ไทย
ไทย Español
 Deutsch
 Български
 Français
 Tiếng Việt
 中文
中文 বাংলা
বাংলা हिन्दी
 Čeština
 Українська
 Română

