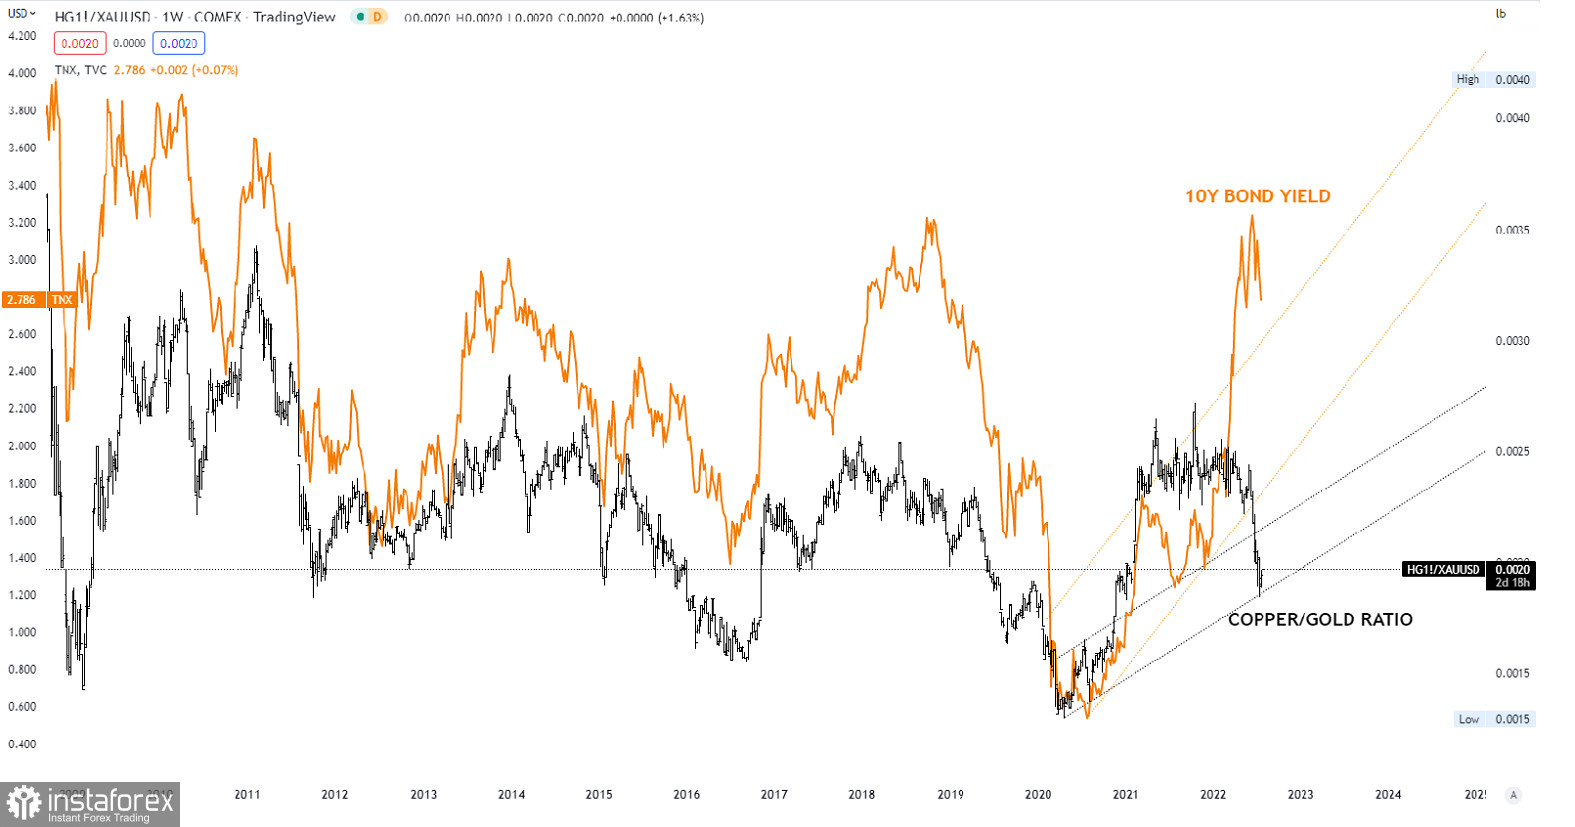
Have the US 10Y yields peaked? We are not so sure they have. The chart above shows the ratio between Copper and Gold and the US 10Y yield. As can be seen, they follow each other according to the latter. However, both are holding above support, which for the copper/gold ratio is at 0.002 and for the US 10Y yield is at 2.5%. As long as these supports are in place, we should expect more upside pressure in both.
For the copper/gold ratio, we could see a rally towards 0.003. For the US 10Y yields, we could see a 3.6% rise before the final peak is reached.
 English
 Русский
 Bahasa Indonesia
 Bahasa Malay
 ไทย
ไทย Español
 Deutsch
 Български
 Français
 Tiếng Việt
 中文
中文 বাংলা
বাংলা हिन्दी
 Čeština
 Українська
 Română

