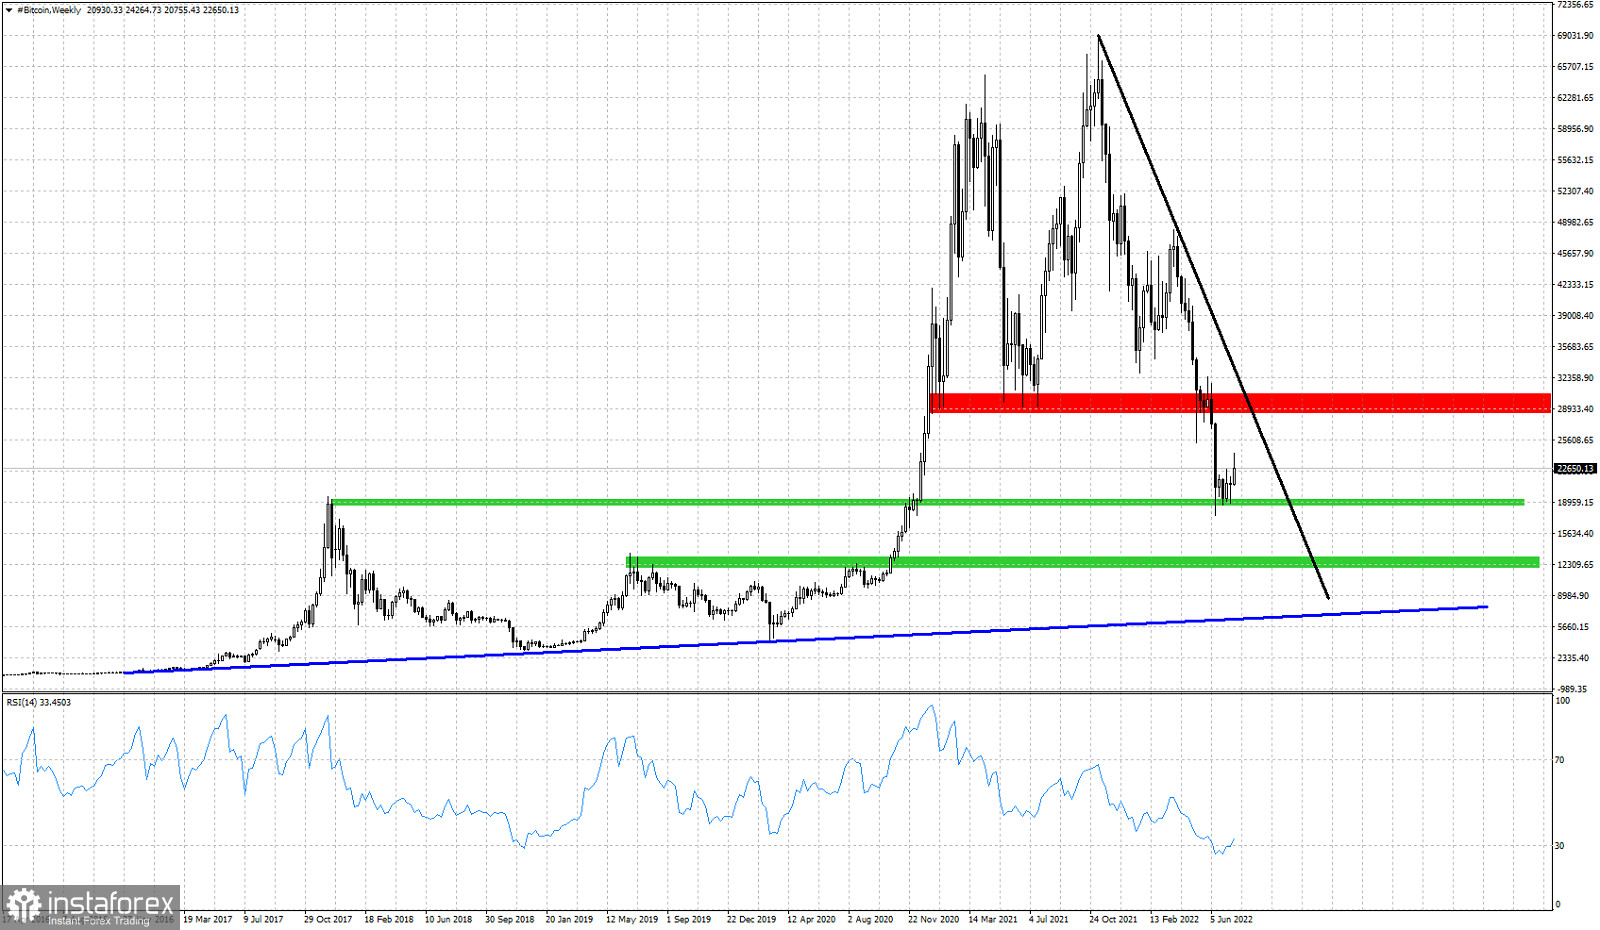
Blue line -long-term support trend line
Green rectangles- horizontal support levels
Red rectangles- horizontal resistance
Black line -resistance trend line
Bitcoin has so far retraced more than 61.8% of its entire upward movement from its lows to the recent all time highs. Price technically remains in a bearish trend making lower lows and lower highs. The last few weeks price is stuck around $18,000-$23,000 with no real progress. Price has stopped its decline right on top of the horizontal support by the 2017 highs. Trend will remain bearish on a weekly basis as long as price is below the black trend line and below the red horizontal resistance around $28,000. If Bitcoin price breaks below the recent lows, we should then see price fall towards the next green horizontal support around $12,000.
 English
 Русский
 Bahasa Indonesia
 Bahasa Malay
 ไทย
ไทย Español
 Deutsch
 Български
 Français
 Tiếng Việt
 中文
中文 বাংলা
বাংলা हिन्दी
 Čeština
 Українська
 Română

