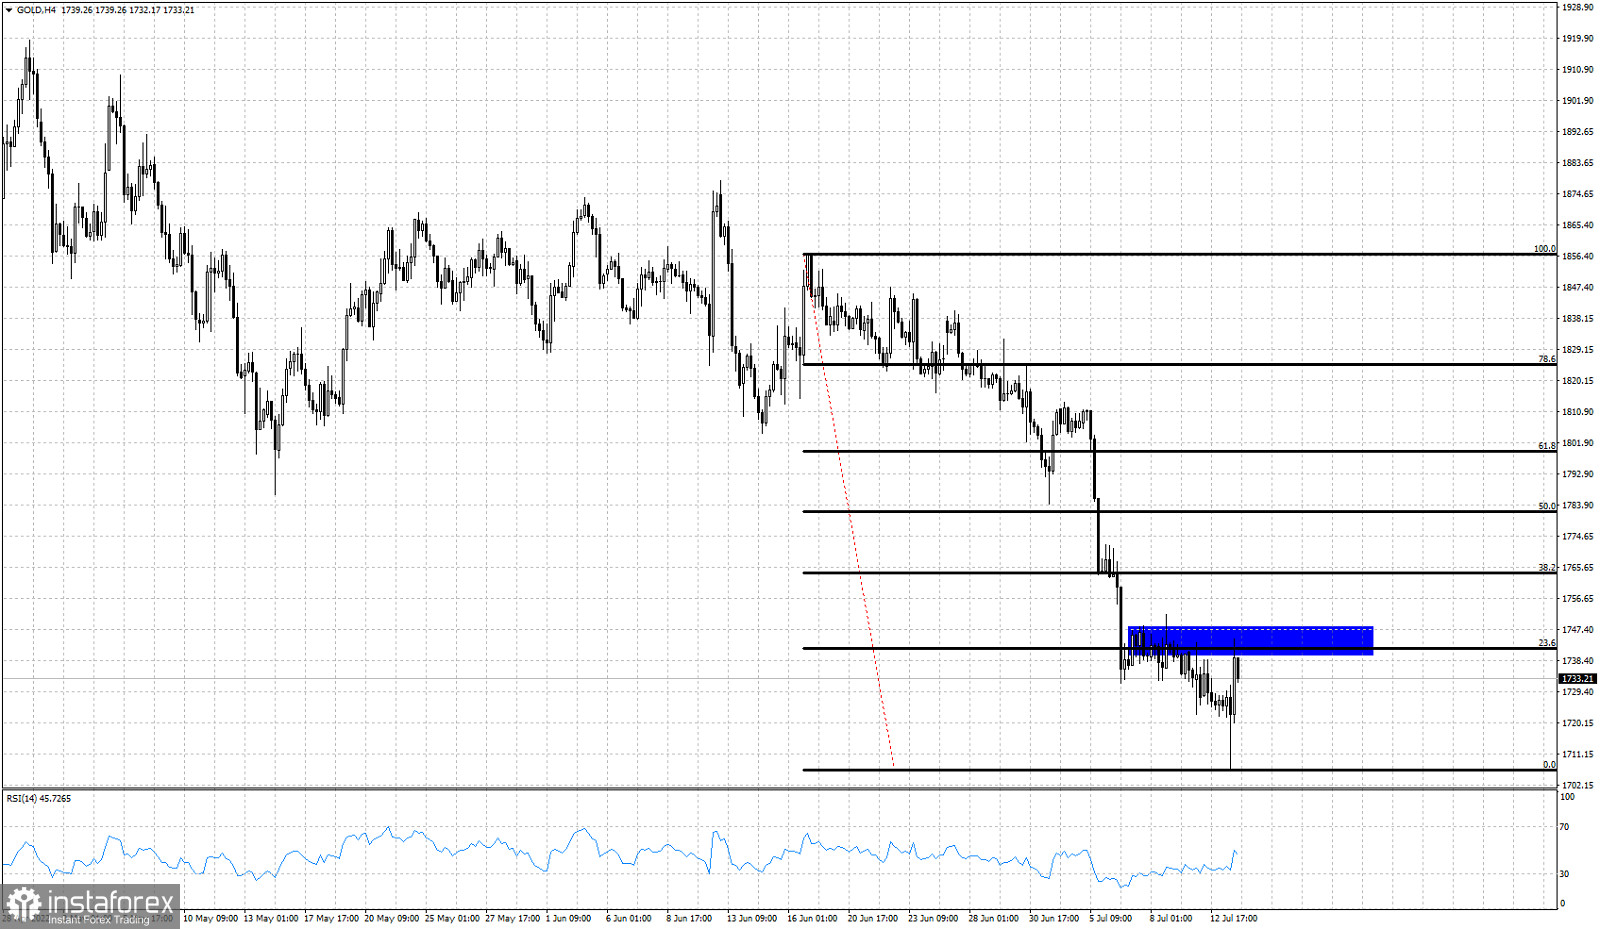
Black lines- Fibonacci retracements
Blue rectangle- resistance
Gold price made a new lower low today at $1,706 but bulls stepped in and have pushed price back above $1,730. Price has managed to rise as high as $1,744 where short-term resistance is found. So far we see a price rejection. Gold has resistance where the blue rectangle is as shown in the 4 hour chart. So far price has retraced 23.6% of the entire decline from $1,856 high. If bulls manage to push price above the blue rectangle, then we should expect to see the 38% Fibonacci level being tested. Support is at $1,720. Failure to hold above this level, will lead Gold to lower lows.
 English
 Русский
 Bahasa Indonesia
 Bahasa Malay
 ไทย
ไทย Español
 Deutsch
 Български
 Français
 Tiếng Việt
 中文
中文 বাংলা
বাংলা हिन्दी
 Čeština
 Українська
 Română

