Technical outlook:
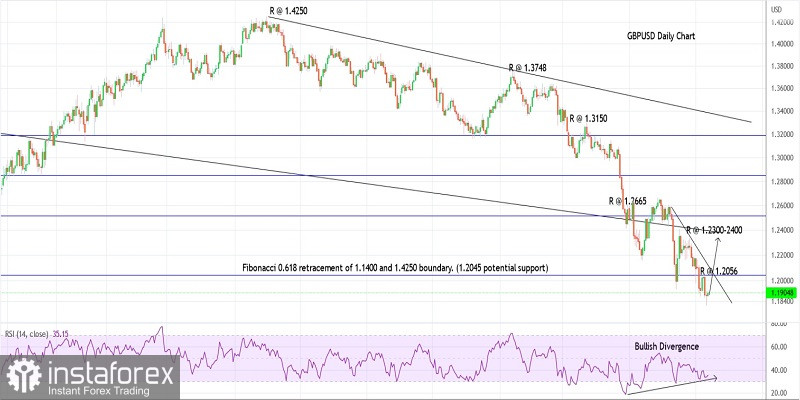
GBPUSD is trading comfortably above the 1.1900 handle after carving a potential bottom at around 1.1800-10 on Tuesday. The currency pair pulled back sharply by over 100 pips after finding support at 1.1807 during the New York session earlier. Furthermore, prices have carved a pinbar/hammer candlestick on the daily chart indicating a potential bullish turn soon.
GBPUSD has been trading lower since January 2021 after hitting the 1.4250 highs and might have terminated its drop close to 1.1800. Also, note that the drop is seen in three waves, hence it looks like a correction between 1.4250 and 1.1807. Potential remains for a bullish reversal from current levels (1.1900) and we expect a push above the 1.4250 resistance in the next several weeks.
GBPUSD is facing immediate price resistance at 1.2056, followed by 1.2300-2400 and higher; while intermediate support comes in around the 1.1800 level respectively. A break above 1.2056 and subsequently 1.2300-2400 will confirm that bulls are back in control and that a meaningful bottom is in place just above 1.1800.
Going forward:
GBPUSD might have completed a larger-degree corrective drop around the 1.1800-10 zone. Further, the recent swing lows have been accompanied by a strong bullish divergence on the daily RSI as presented here. The high probability remains for a bullish turn from current levels and a break could follow through lined-up resistance at 1.2056, 1.2300-2400, and 1.2665.
Trading plan:
Potential rally towards 1.2665 against 1.1700
Good luck!
 English
 Русский
 Bahasa Indonesia
 Bahasa Malay
 ไทย
ไทย Español
 Deutsch
 Български
 Français
 Tiếng Việt
 中文
中文 বাংলা
বাংলা हिन्दी
 Čeština
 Українська
 Română

