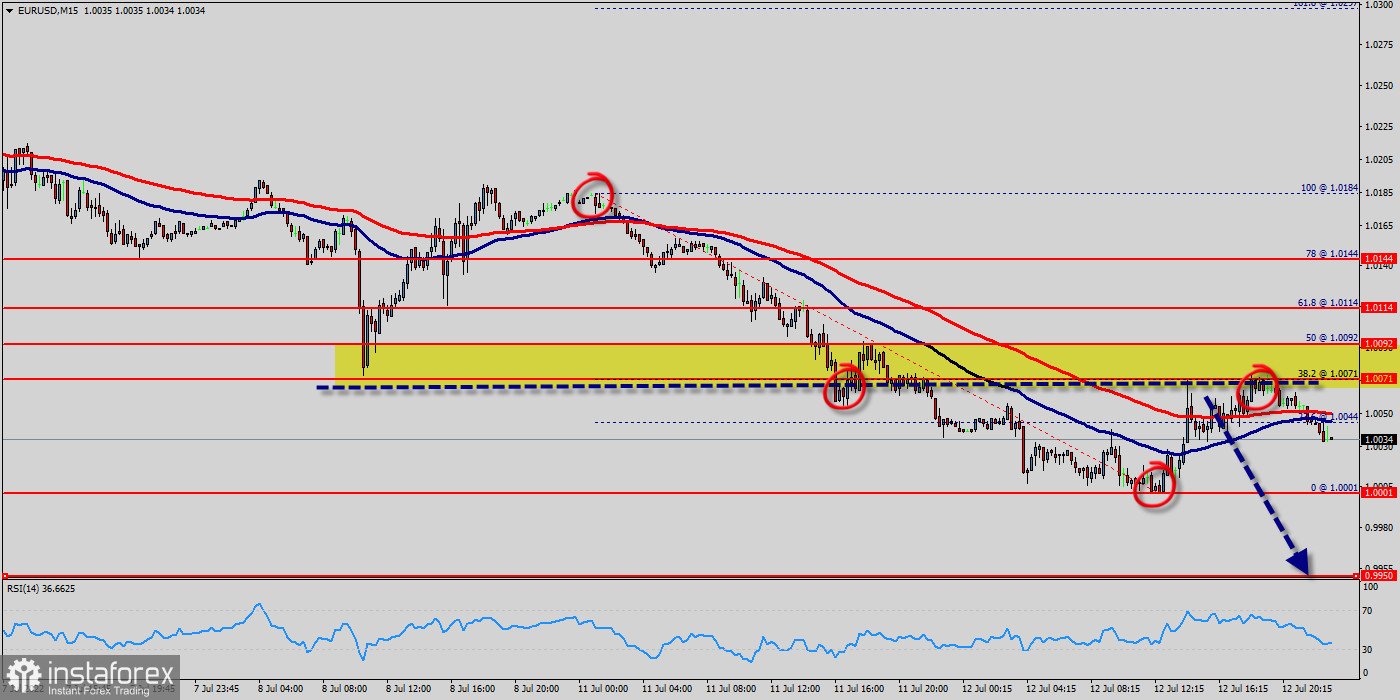
Overview : The EUR/USD continued to depreciate to 1.0001, edging closer toward dollar parity for the first time in 20 years, as the energy crisis increased the risk of recession making it more difficult for the ECB to tighten the monetary policy and as the greenback was boosted by safe-haven demand. The EUR/USD pair rebounded temporary from the bottom of 1.0001 to reach 1.0071 for an uptrend correction. After falling from 1.0144 at the start of the week, the EUR/USD pair started this morning to drop at 1.0001. From that low point, the share price rose towards 1.0071 before taking another leg lower to 1.0000 again. We had already talked about the psychological price which sets at 1.0000 ( 1 Euro equals 1 US dollar). However, the EUR remains under pressure following the meeting, mainly because of the deteriorating outlook for the eurozone economy. The ECB slashed the gross domestic product (GDP) forecast for the region to 3%, down from 4%. The central bank also hiked the inflation outlook from 6% to 7%. The EUR/USD pair fell from the level of 1.0144 to bottom at 1.0001 this morning. Today, the EUR/USD pair has faced strong support at the level of 1.0144. So, the strong support has been already faced at the level of 1.0144 and the pair is likely to try to approach it in order to test it again and form a double bottom (1.0000). Hence, the EUR/USD pair is continuing to trade in a bearish trend from the new support level of 1.0144 ; to form a bearish channel. According to the previous events, we expect the pair to move between 1.0144 and 0.9950. Also, it should be noted major resistance is seen at 1.0200, while immediate resistance is found at 1.0092. Then, we may anticipate potential testing of 1.0092to take place soon. Moreover, if the pair fails in passing through the level of 1.0092, the market will indicate a bearish opportunity below the level of 1.0092. A breakout of that target will move the pair further downwards to 1.0000. Consequently, there is a possibility that the EUR/USD pair will move downside. The structure of a fall does not look corrective. In order to indicate a bearish opportunity below 1.0092, sell below 1.0092 with the first target at 1.0000. The level of 1.0092 coincides with 50% of Fibonacci, which is expected to act as a major resistance today. Since the trend is below the 50% Fibonacci level, the market is still in a downtrend. Equally important, the RSI is still calling for a strong bearish market as well as the current price is also below the moving average 100. As a result, sell below the weekly pivot point of 1.0092 with targets at 1.0000 and 0.9950 in order to form a new double bottom. Nevertheless, stop loss should always be taken into account, accordingly, it will be of beneficial to set the stop loss above the last bullish wave at the level of 1.0200.
 English
 Русский
 Bahasa Indonesia
 Bahasa Malay
 ไทย
ไทย Español
 Deutsch
 Български
 Français
 Tiếng Việt
 中文
中文 বাংলা
বাংলা हिन्दी
 Čeština
 Українська
 Română

