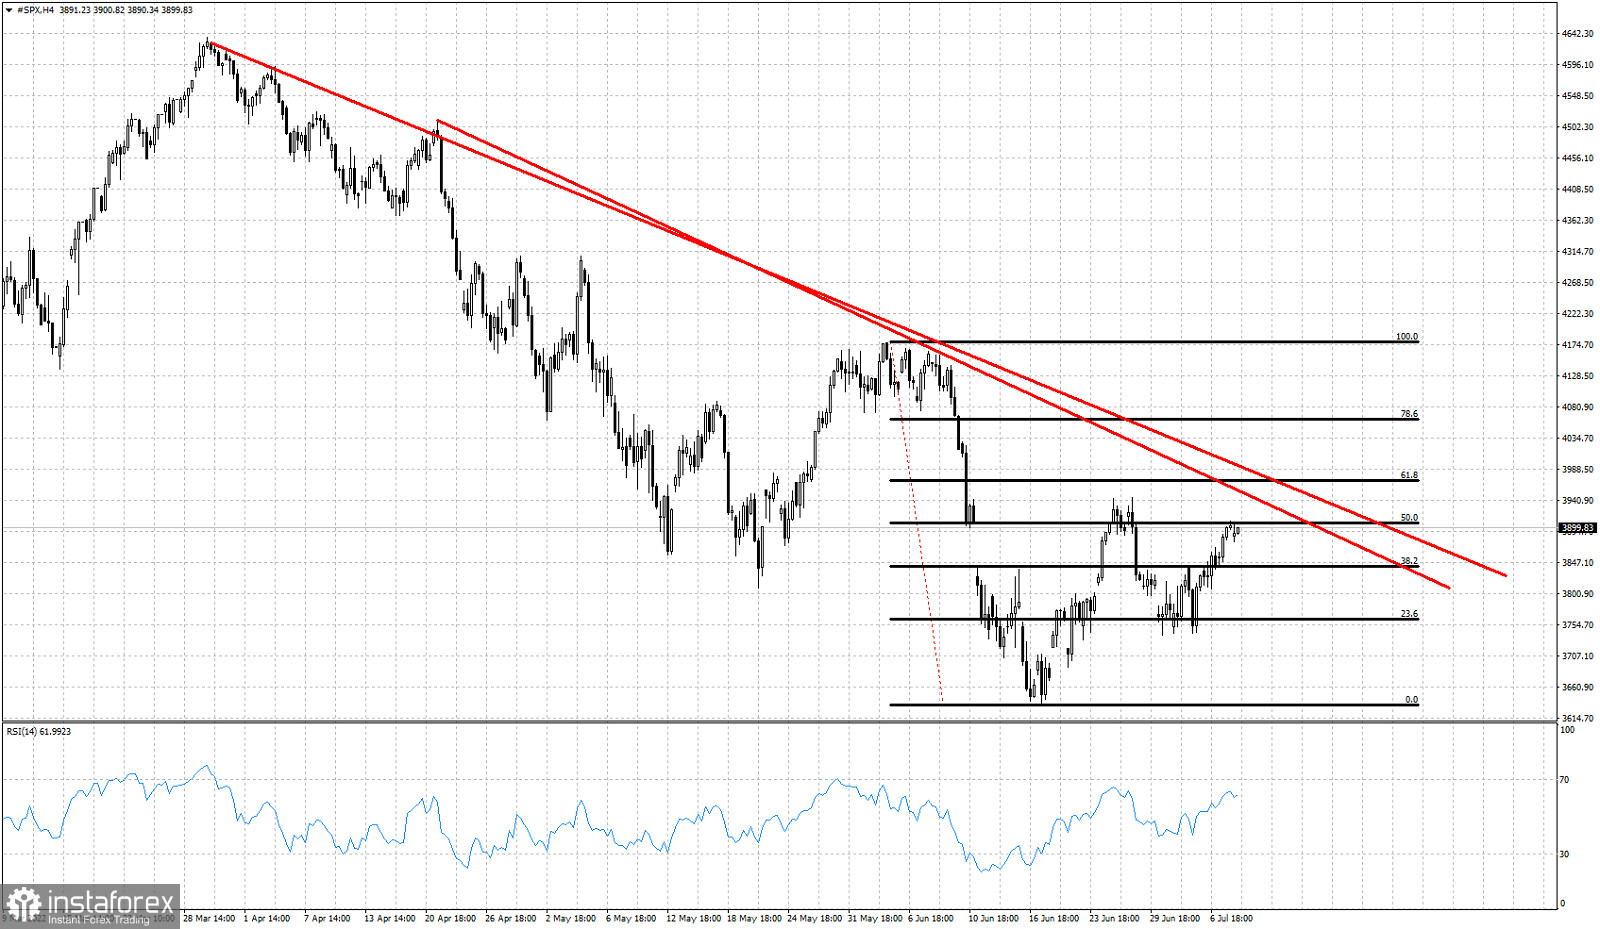
Red lines- Resistance trend line
Black lines -Fibonacci retracements
SPX is trading above 3,800 and bulls try to form higher highs and higher lows. Trend remains bearish in the medium-term since the 4,800 top as price continues making lower lows and lower highs. Price is now approaching key resistance area. Price justifies a move higher as a counter trend rally. However our most probable scenario is for the down trend to resume and SPX fall even lower. In the near term SPX has the potential to reach the two red downward sloping resistance trend lines. Our most probable target is at the 61.8% Fibonacci retracement. This target is at 3,970 and it is very possible to see price challenge this level. Support is found at recent low of 3,737. Bulls do not want to see price below this level as this will signal the end of any bounce higher.
 English
 Русский
 Bahasa Indonesia
 Bahasa Malay
 ไทย
ไทย Español
 Deutsch
 Български
 Français
 Tiếng Việt
 中文
中文 বাংলা
বাংলা हिन्दी
 Čeština
 Українська
 Română

