USD/JPY Sideways Movement!
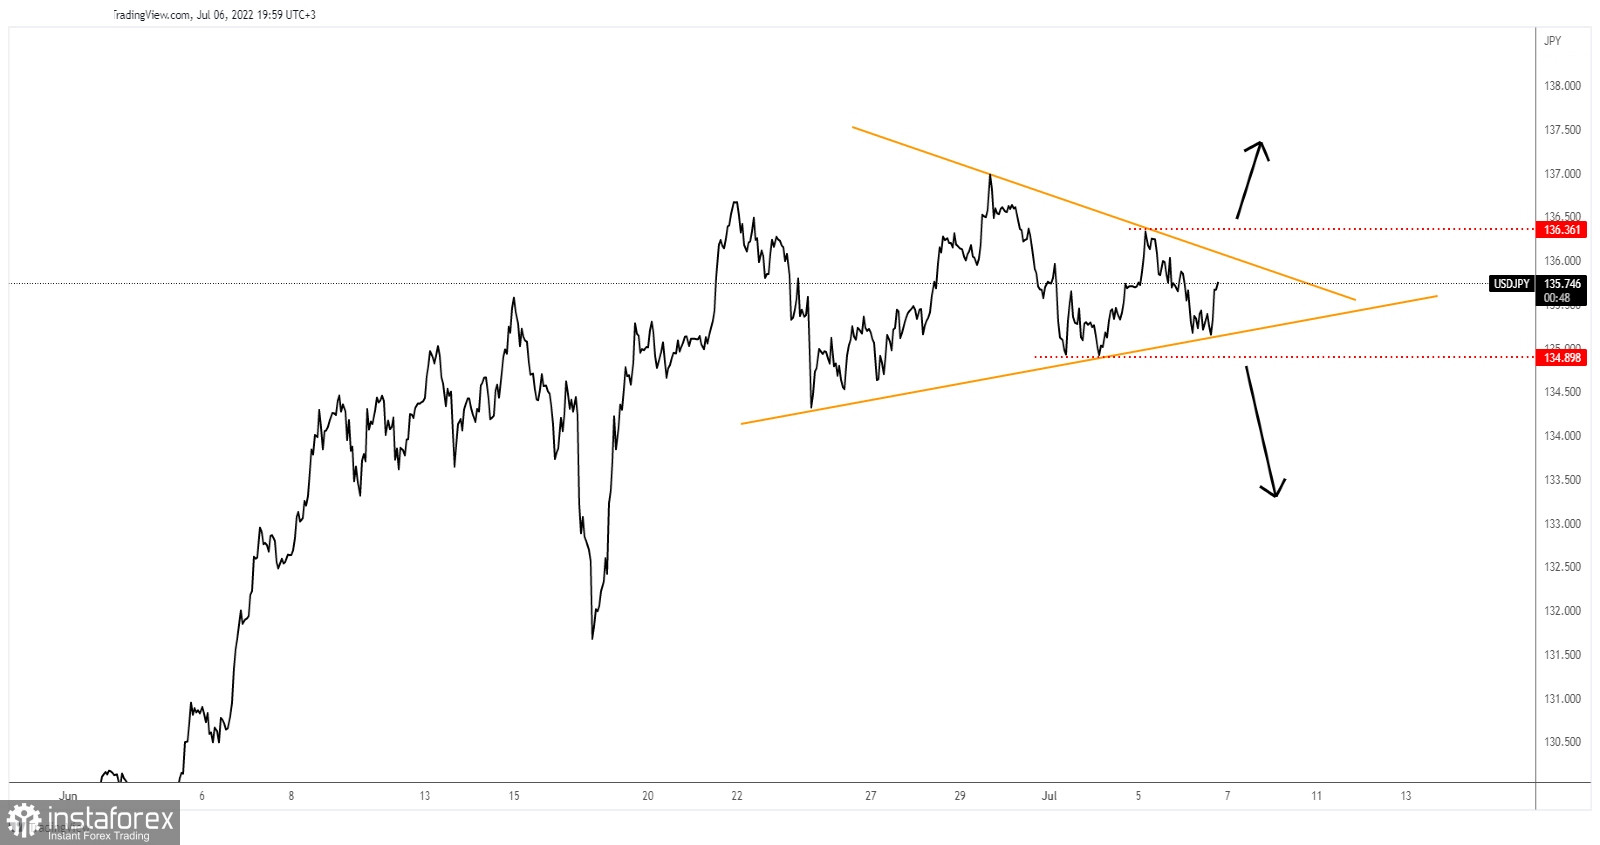
The USD/JPY pair continues to move in range in the short term. The price action developed a triangle pattern, so personally, I'll wait for the price to escape from this formation before buying or selling.
As you can see, the rate is trapped between 136.36 and 134.89 levels. USD/JPY retested the triangle's downside line which is seen as a downside obstacle and now it approaches the upside line, the downtrend line which stands as an upside obstacle.
USD/JPY Trading Conclusion!
Jumping above the downtrend line and above 136.36 could signal further growth and could bring new buying opportunities.
Dropping and stabilizing below the uptrend line and under 134.89 may announce more declines and could help the sellers to catch a downside movement.
 English
 Русский
 Bahasa Indonesia
 Bahasa Malay
 ไทย
ไทย Español
 Deutsch
 Български
 Français
 Tiếng Việt
 中文
中文 বাংলা
বাংলা हिन्दी
 Čeština
 Українська
 Română

