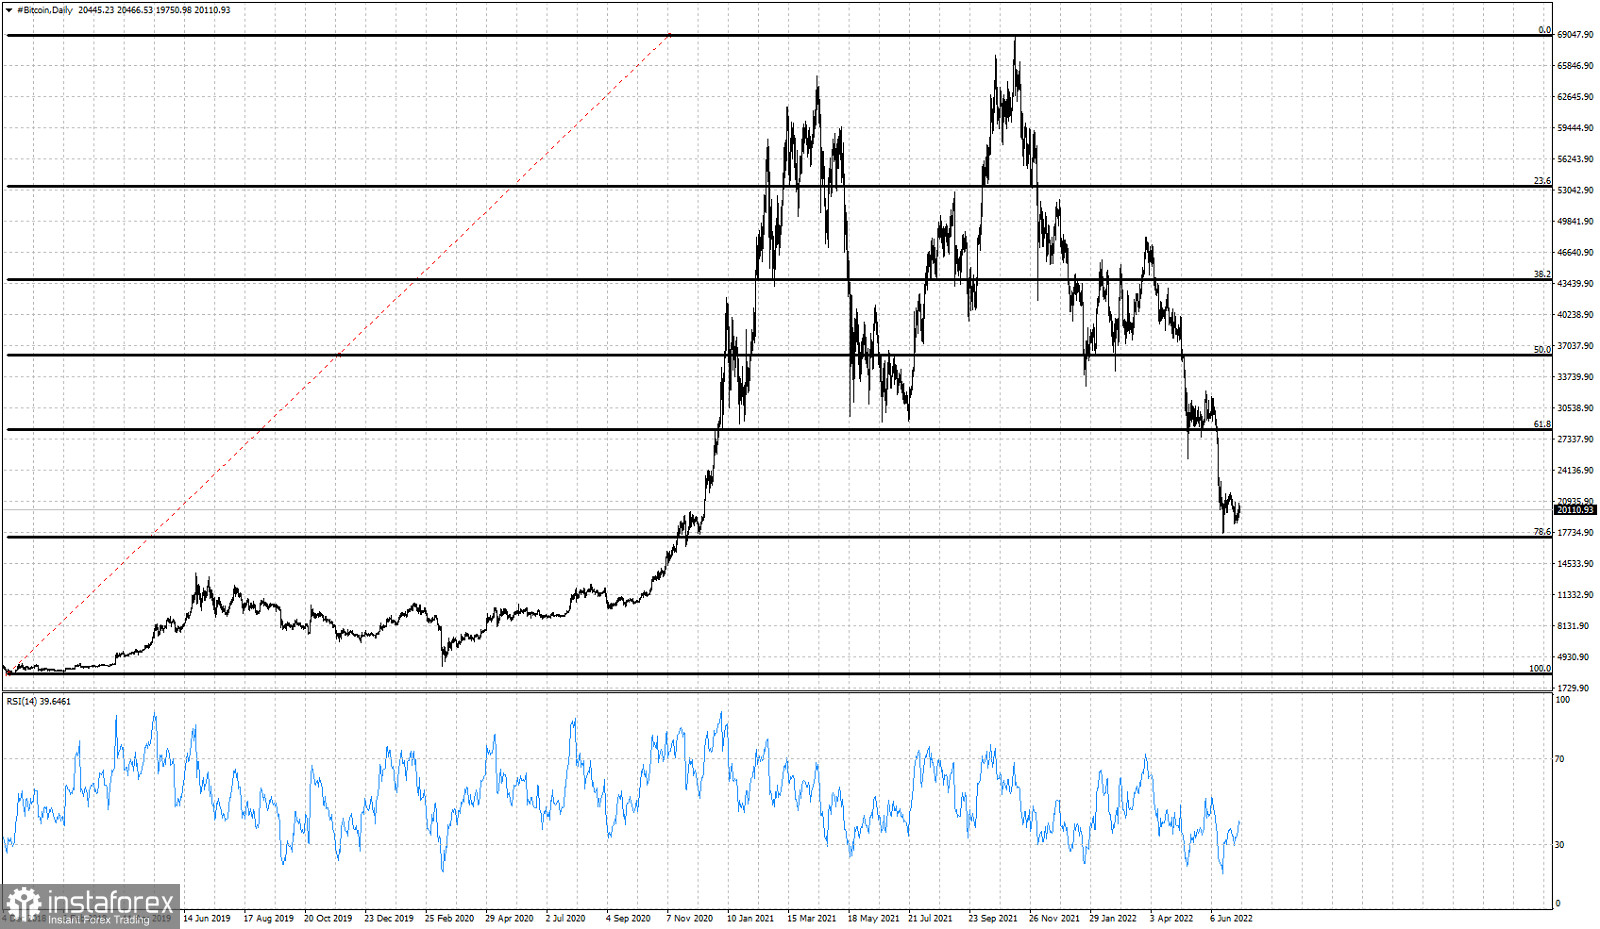
Black lines - Fibonacci retracement levels
Bitcoin has so far retraced almost 78.6% of its entire upward move to its all time highs. Such deep corrections are not something unusual in crypto space. Trend technically remains bearish as price is approaching long-term Fibonacci support levels. At $17,000 we find the 78.6% Fibonacci retracement. Price continues making lower lows and lower highs. The RSI has recently made new lows and is turning upwards from oversold levels. There is no bullish divergence in the Daily chart and that is the main reason we continue to expect Bitcoin to move even lower towards $17,000 and maybe lower. Does this mean we should be short Bitcoin? No.It means that Bitcoin could soon make a strong move higher. The closer we get to $17,000 the higher the chances of a reversal, specially if we see a bullish divergence in the RSI.

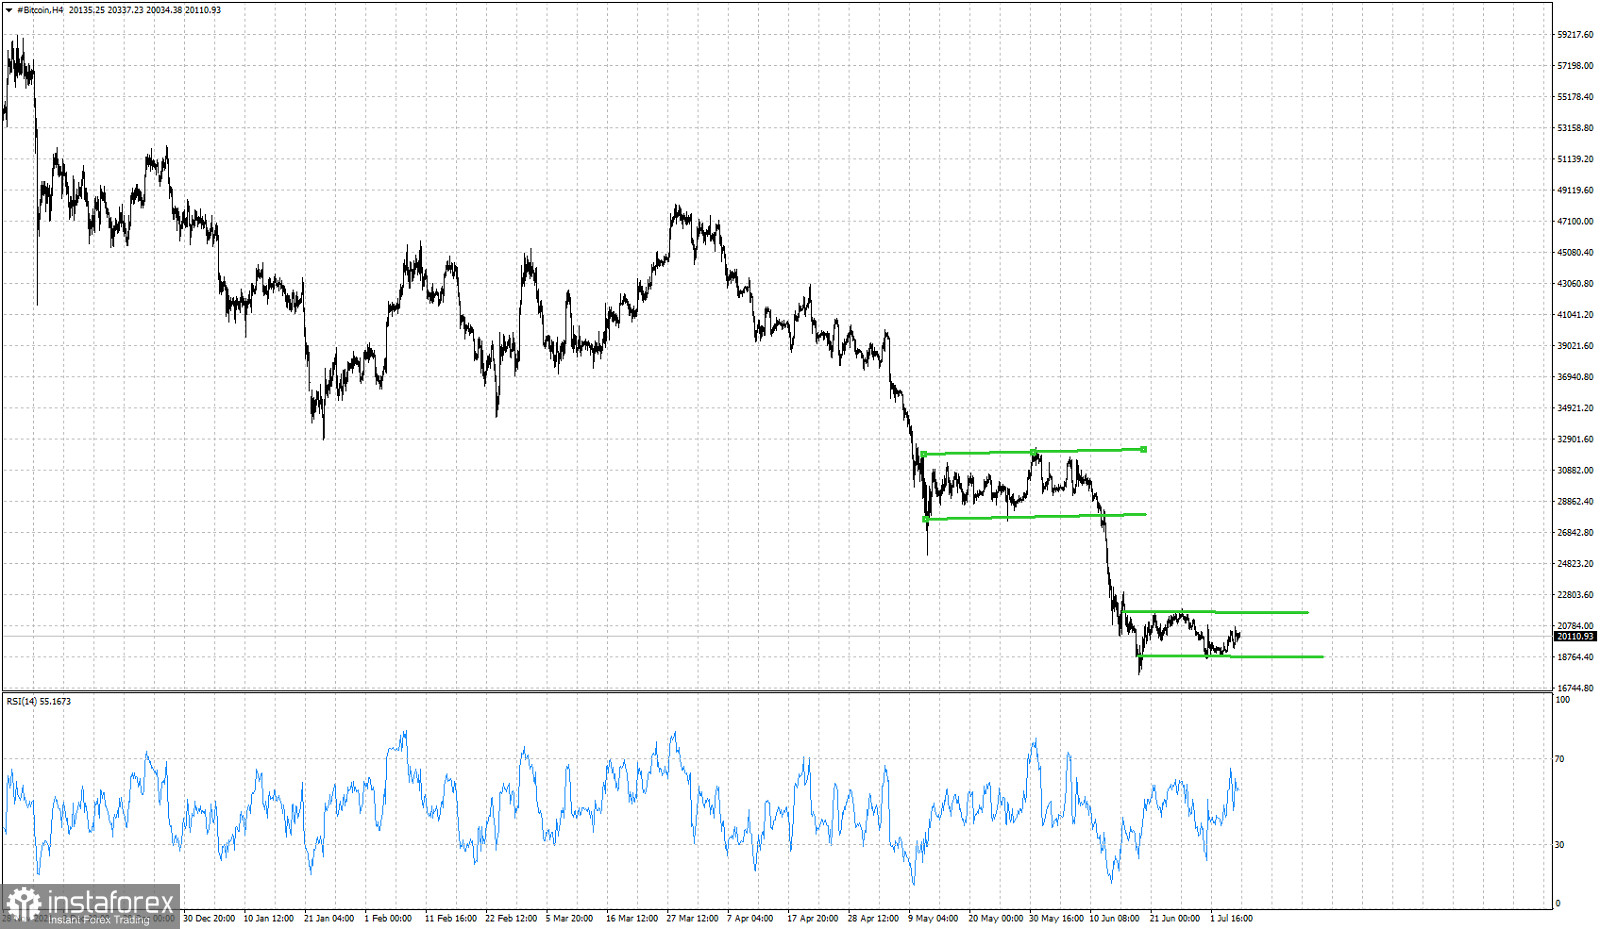
Green lines- corrective phase
Zooming in the 4 hour chart we see Bitcoin moving sideways similar to what it did in May when it was trading between $27,000 and $31,000, before breaking support and pushing towards $20,000. The chances of a repetition in price action are high. Bitcoin remains vulnerable to more downside. A move towards $17,000 is still very probable. So far Bitcoin price action has shown no signs of a reversal or a bottom.
 English
 Русский
 Bahasa Indonesia
 Bahasa Malay
 ไทย
ไทย Español
 Deutsch
 Български
 Français
 Tiếng Việt
 中文
中文 বাংলা
বাংলা हिन्दी
 Čeština
 Українська
 Română

