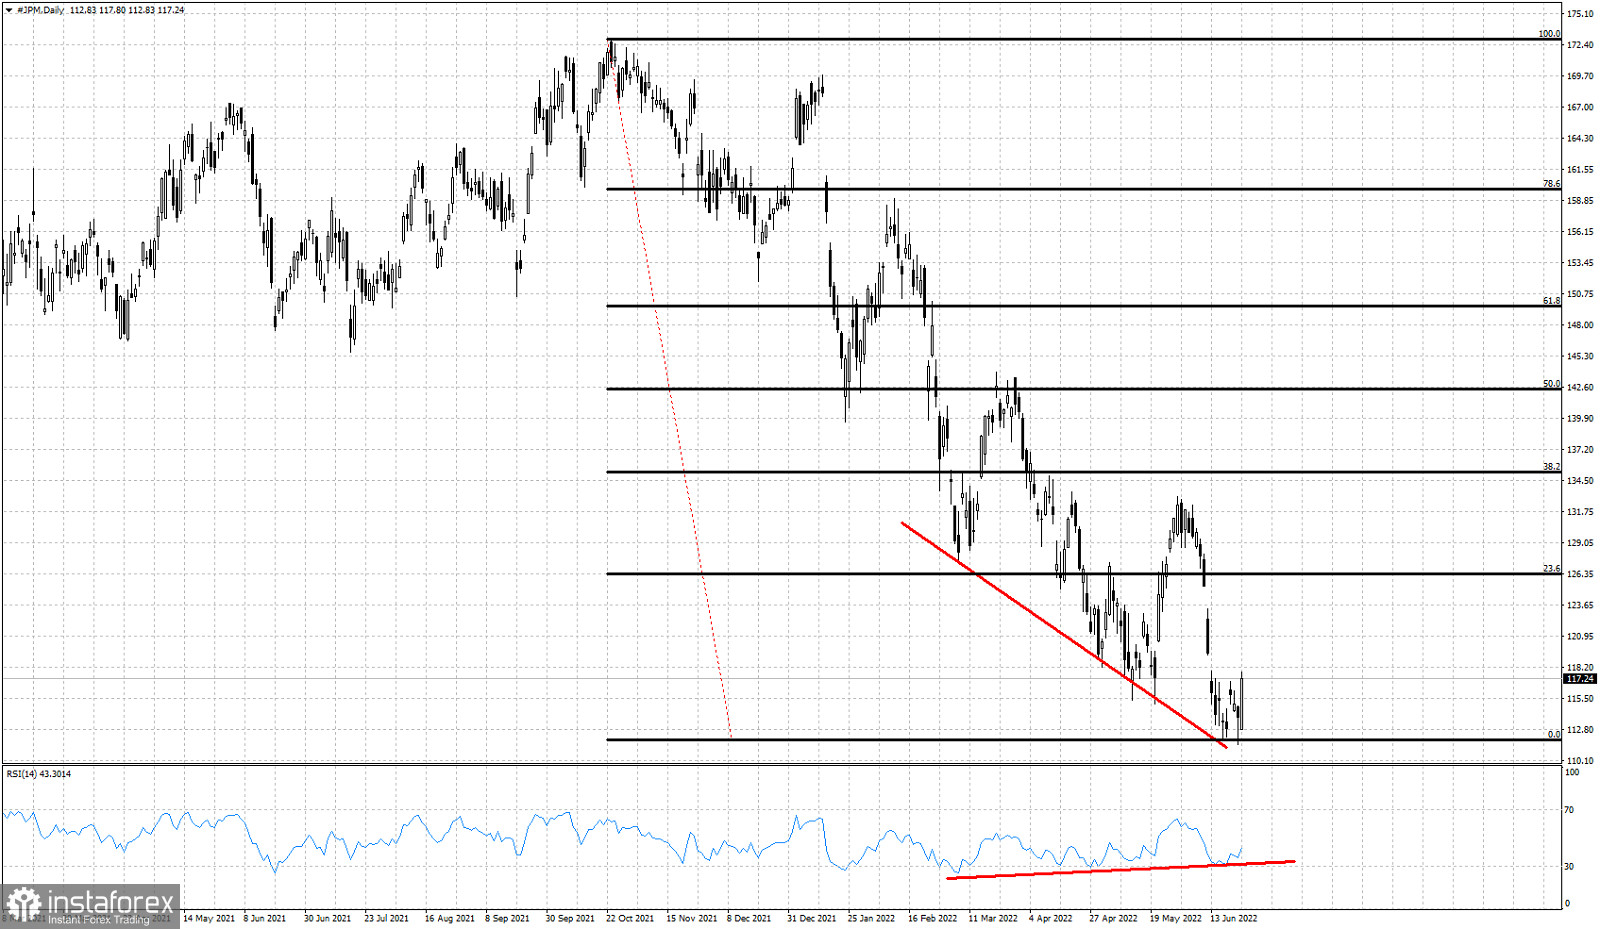
Red lines -Bullish RSI divergence
Black lines -Fibonacci retracement levels
JPM made a new lower low last week around $111.47 but closed the week positive at $117.24. With a bullish reversal hammer on the weekly chart and a new bullish divergence of the RSI in the Daily chart, JPM is candidate to push higher this coming week. JPM stock price has provided us with a bullish setup and we expect this week to see at least a bounce towards $126 where we find the minimum retracement level of 23.6%. This is also short-term resistance. If bulls manage to break above it, then we should expect JPM stock price to continue higher towards $135 at the 38% retracement level.
 English
 Русский
 Bahasa Indonesia
 Bahasa Malay
 ไทย
ไทย Español
 Deutsch
 Български
 Français
 Tiếng Việt
 中文
中文 বাংলা
বাংলা हिन्दी
 Čeština
 Українська
 Română

