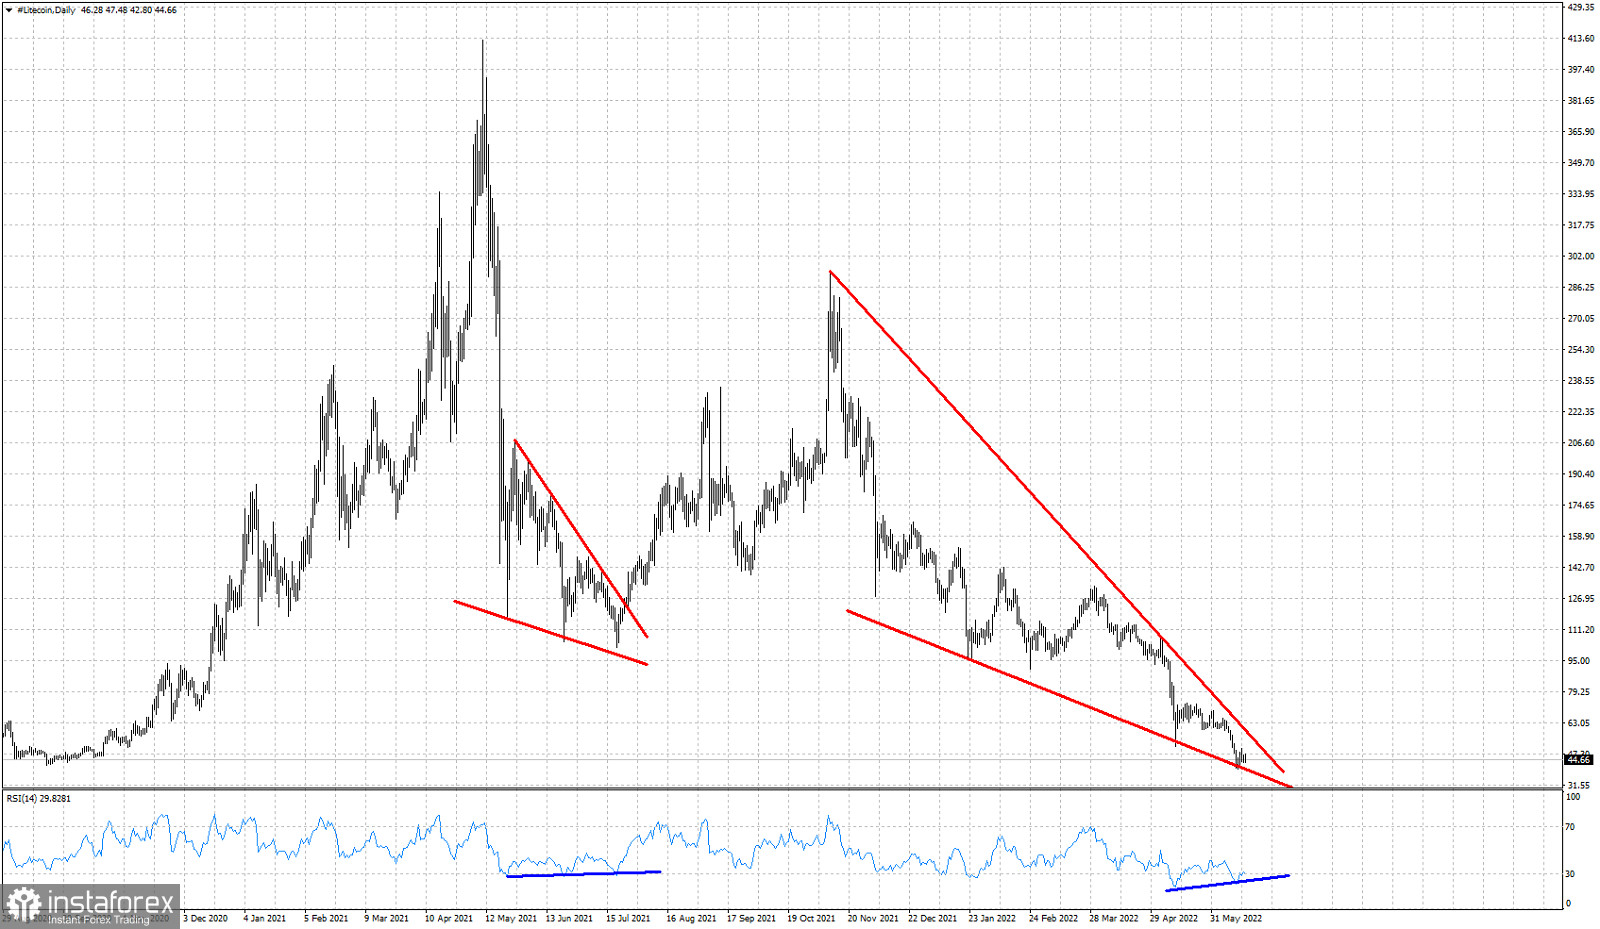
Red lines- downward sloping wedge patterns
Blue lines- bullish divergence
Litecoin remains in a bearish trend making lower lows and lower highs. Price is showing a similarity to the pattern it followed one year ago. In both cases we see price forming a downward sloping wedge pattern and the RSI providing bullish divergence signals. Resistance by the wedge pattern upper boundary is at $58-59. A break above this level will be a bullish signal. Until then I would expect price to continue its drift lower.
 English
 Русский
 Bahasa Indonesia
 Bahasa Malay
 ไทย
ไทย Español
 Deutsch
 Български
 Français
 Tiếng Việt
 中文
中文 বাংলা
বাংলা हिन्दी
 Čeština
 Українська
 Română

