XAU/USD Seems Undecided!
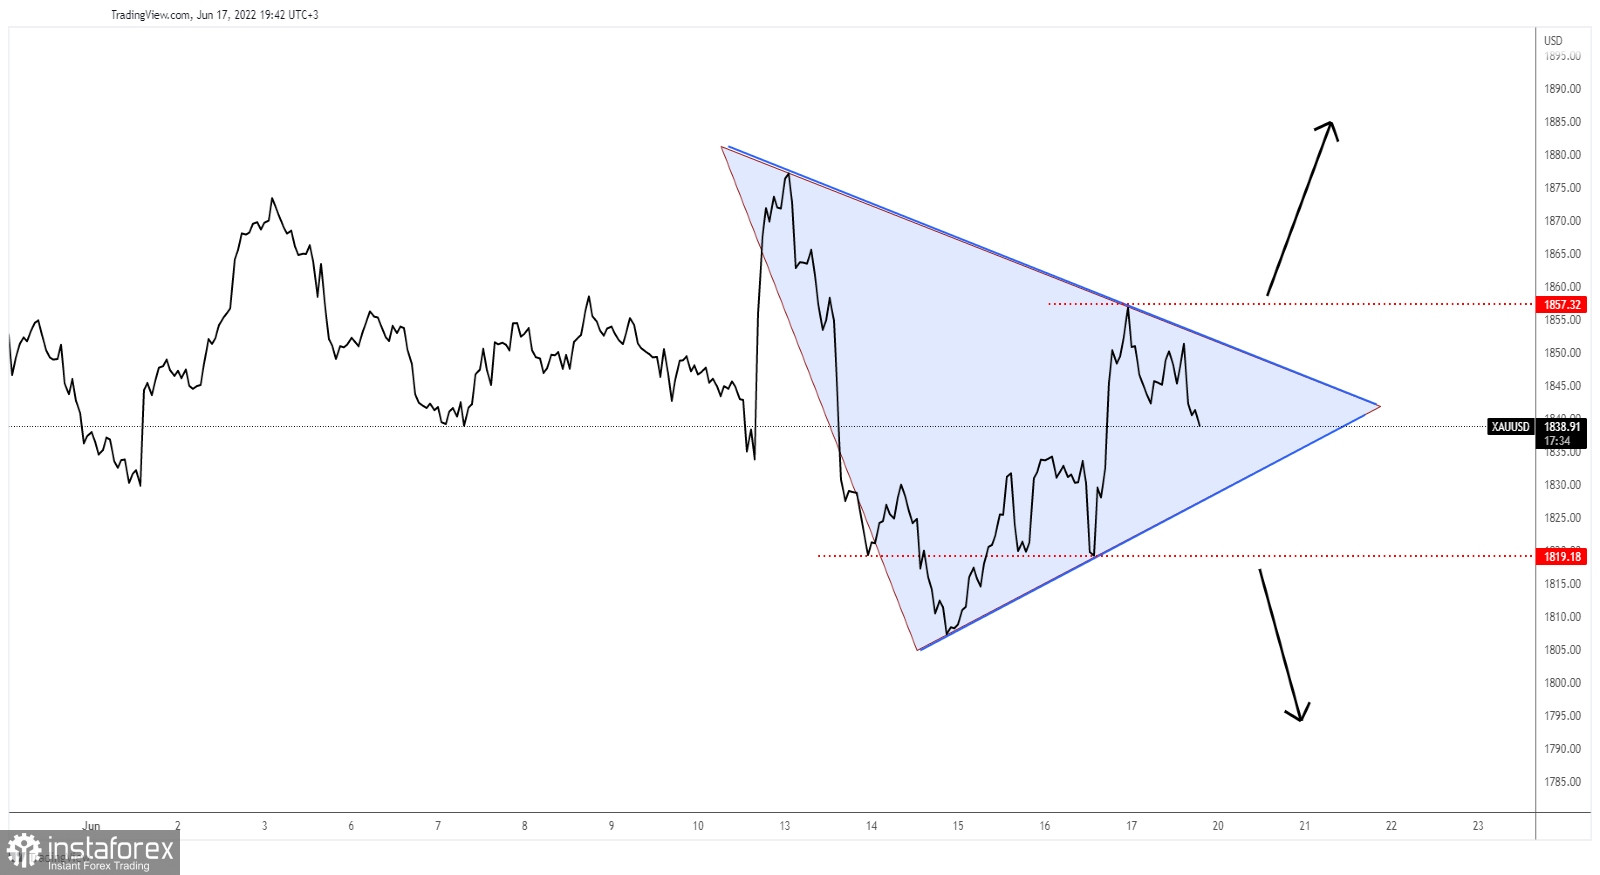
The price of gold is moving somehow sideways in the short term. It was trading at 1,839 at the time of writing. As you can see on the H1 chart, XAU/USD is trapped within a triangle pattern.
The 1,857 former high is seen as an upside obstacle, while the 1,819 former low represents a downside obstacle. The triangle's upside and downside lines are seen as immediate obstacles.
Gold Trading Conclusion!
Jumping and stabilizing above 1,857 could activate further growth and bring new buying opportunities.
Dropping and stabilizing below 1,819 activates more declines and could help the sellers to catch a downside continuation.
 English
 Русский
 Bahasa Indonesia
 Bahasa Malay
 ไทย
ไทย Español
 Deutsch
 Български
 Français
 Tiếng Việt
 中文
中文 বাংলা
বাংলা हिन्दी
 Čeština
 Українська
 Română

