Overview :
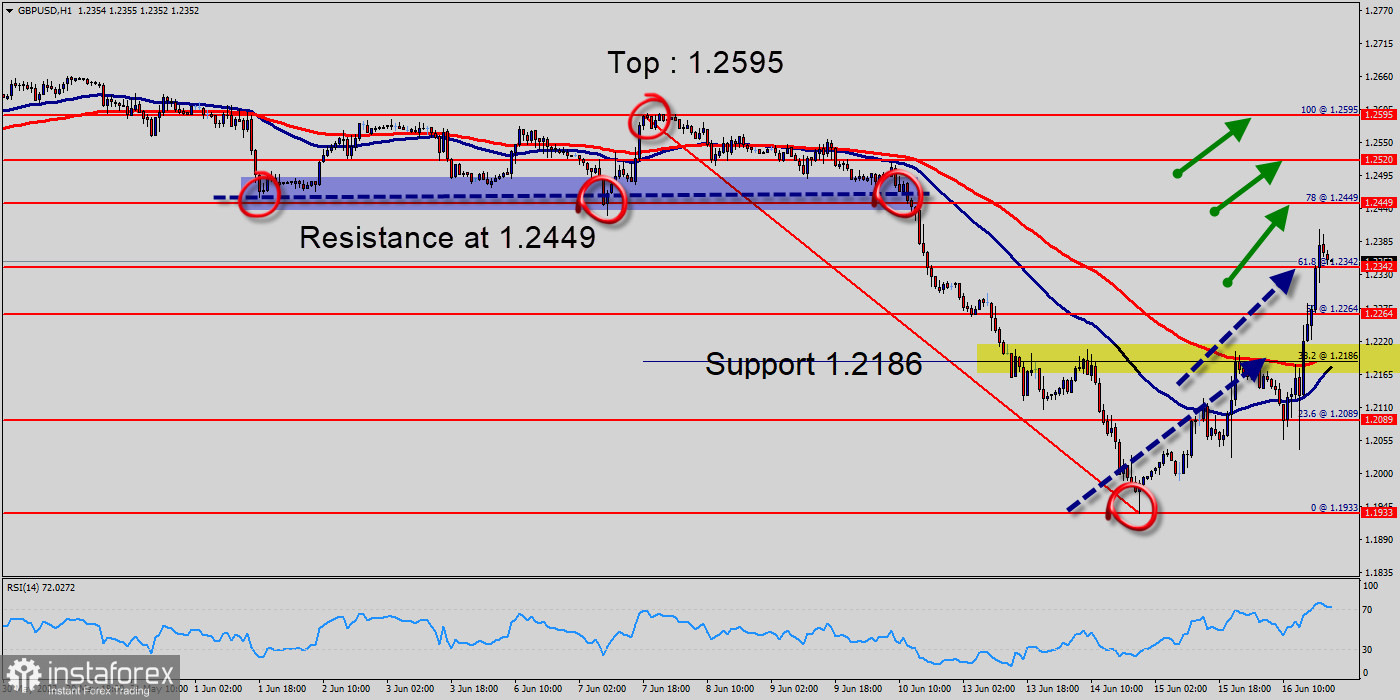
The GBP/USD traded higher and closed the day in positive zone near the price of 1.2186. Today it was trading in a narrow range of 1.2342.
On the hourly chart, the GBP/USD pair is still trading above the MA (200) H1 moving average line (1.2186). The situation is similar on the one-hour chart.
Based on the foregoing, it is probably worth sticking to the north direction in trading, and while the GBP/USD pair remains above MA 100 H1, it may be necessary to look for entry points to buy for the formation of a correction from the prices of 1.2186 and/or 1.2342.
Due to the strong upside momentum and breakout , watch for further rise towards the next major level.
On the upside, solide resistance is located at 1.2449 (Fibonacci 78% retracement). A four-hour close above that level could be seen as a bullish development and open the gate for an extended toward 1.2520.
The GBP/USD pair is staying in consolidation above 1.2264 and intraday bias remains uptrend. Outlook stays bullish with 1.2342 support intact.
The pair has already formed minor support at 1.2342.The strong support is seen at the level of 1.2186 because it represents the weekly support 1.
Equally important, the Relative Strength Index (RSI) is considered overbought because it is above 70. The RSI is still signaling that the trend is upward as it is still strong above the moving average (100). This suggests the pair will probably go up in coming hours.
Therefore, the market indicates a bullish opportunity at the level of 1.2342 in the H1 chart.
Accordingly, the market is likely to show signs of a bullish trend. In other words, buy orders are recommended above 1.2342 with the first target at the level of 1.2449.
From this point, the pair is likely to begin an ascending movement to the point of 1.2449 and further to the level of 1.2520. The level of 1.2520 will act as strong resistance and the double top is already set at the point of 1.2595.
On the downside, sustained break of 50% projection of 1.2264 to 1.2186. On the other hand, if a breakout happens at the support level of 1.2186, then this scenario may become invalidated.
 English
 Русский
 Bahasa Indonesia
 Bahasa Malay
 ไทย
ไทย Español
 Deutsch
 Български
 Français
 Tiếng Việt
 中文
中文 বাংলা
বাংলা हिन्दी
 Čeština
 Українська
 Română

