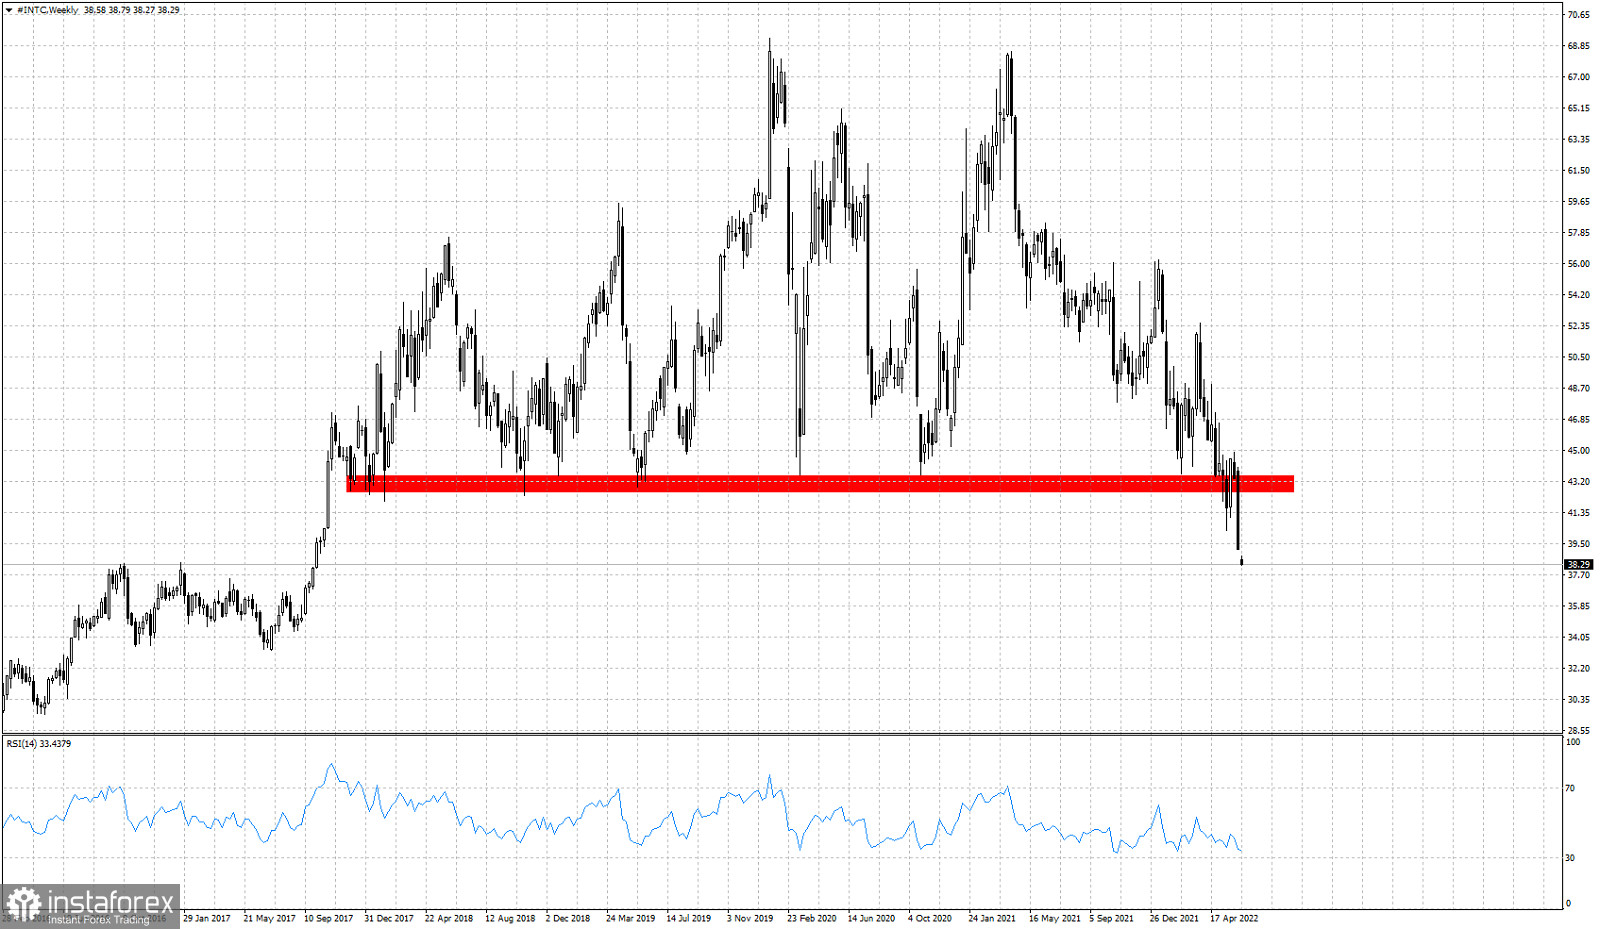
 analysis on the stock price action of Intel Corp., we noted that a break below the multi year horizontal support around $42.50 would be a bearish sign and that price would then continue lower. Price had already tested the support back then and it was bouncing higher. Last week price broke below it and closed the week at weekly lower lows. This week starts again with price under pressure. Price has lost the $39 price level and is moving lower. Trend remains bearish on a weekly basis as we can see in the chart above. The RSI has still not reached oversold levels. We remain pessimistic on INTC stock price as long as price is below $42.50.
FX.co ★ Weekly INTC stock price analysis.
 Relevance until
Weekly INTC stock price analysis.
*The market analysis posted here is meant to increase your awareness, but not to give instructions to make a trade
 English
 Русский
 Bahasa Indonesia
 Bahasa Malay
 ไทย
ไทย Español
 Deutsch
 Български
 Français
 Tiếng Việt
 中文
中文 বাংলা
বাংলা हिन्दी
 Čeština
 Українська
 Română
