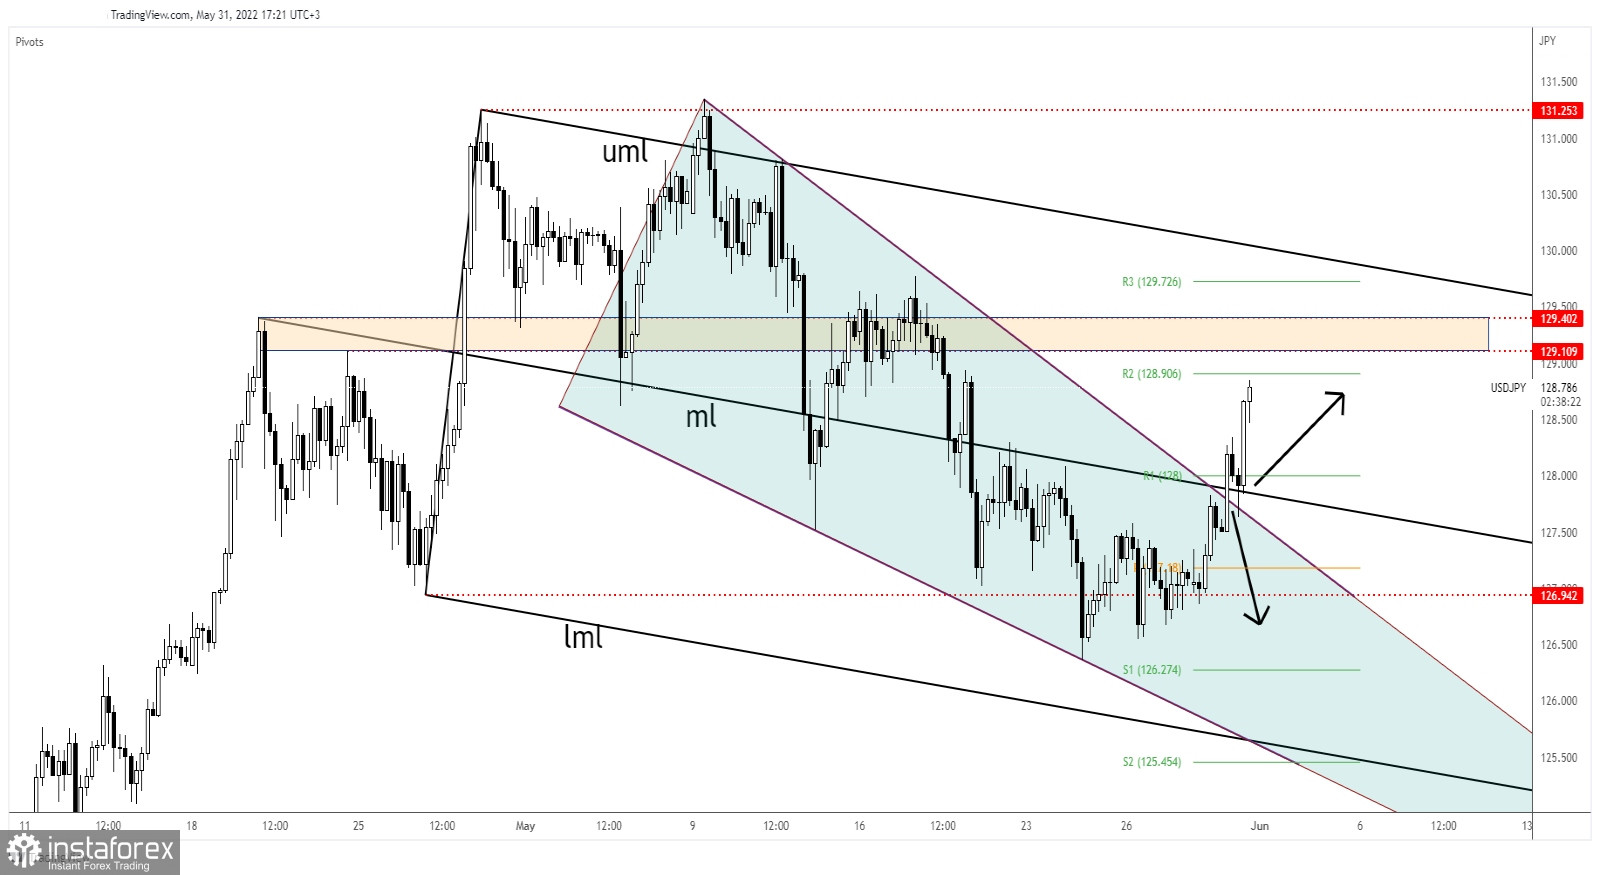
The USD/JPY pair edged higher at the time of writing as the Dollar Index rebounded while the Japanese Yen Futures dropped. As you already know from my last analysis, the price signaled exhausted sellers and it has developed a Falling Wedge bullish pattern.
Fundamentally, the Japanese economic data came in mixed. The Unemployment Rate came in at 2.5% versus 2.6% expected, Prelim Industrial Production dropped by 1.3%, while Retail Sales surged by 2.9%. In addition, Housing Starts rose only by 2.2% versus 2.5% estimates, while Consumer Confidence came in at 34.1 above 33.9 estimates.
Earlier, the US CB Consumer Confidence, Chicago PMI, and the S&P/CS Composite-20 HPI reported better than expected data lifting the USD.
USD/JPY Attracted By 129.10 - 129.40 Area!

As you can see on the h4 chart, the USD/JPY pair is strongly bullish. I've told you that a valid breakout above the Falling Wedge's resistance and through the median line (ml) could confirm further growth.
The price retested the broken resistance levels signaling strong growth. Now, it was almost to reach the weekly R2 (128.90) which stands as a static resistance. Also, the 129.10 - 129.40 area represents a resistance zone.
USD/JPY Outlook!
Its valid breakout above the downtrend line and through the median line (ml) represented a long opportunity with a first upside target at 129.10 - 129.40.
New long opportunities could appear after a temporary retreat, after a small consolidation, or after a valid breakout above the 129.10 - 129.40 area.
 English
 Русский
 Bahasa Indonesia
 Bahasa Malay
 ไทย
ไทย Español
 Deutsch
 Български
 Français
 Tiếng Việt
 中文
中文 বাংলা
বাংলা हिन्दी
 Čeština
 Українська
 Română

