 English
  Русский
 Bahasa Indonesia
 Bahasa Malay
 ไทย
ไทย Español
 Deutsch
 Български
 Français
 Tiếng Việt
 中文
中文 বাংলা
বাংলা हिन्दी
 Čeština
 Українська
 Română

Bitcoin has managed to climb once again above the $30,000 price level but to be fair, price has made no real progress for the last three weeks. Price continues trading sideways. Last week we had a fake break down towards $27,000 but bulls stepped in and provided support.
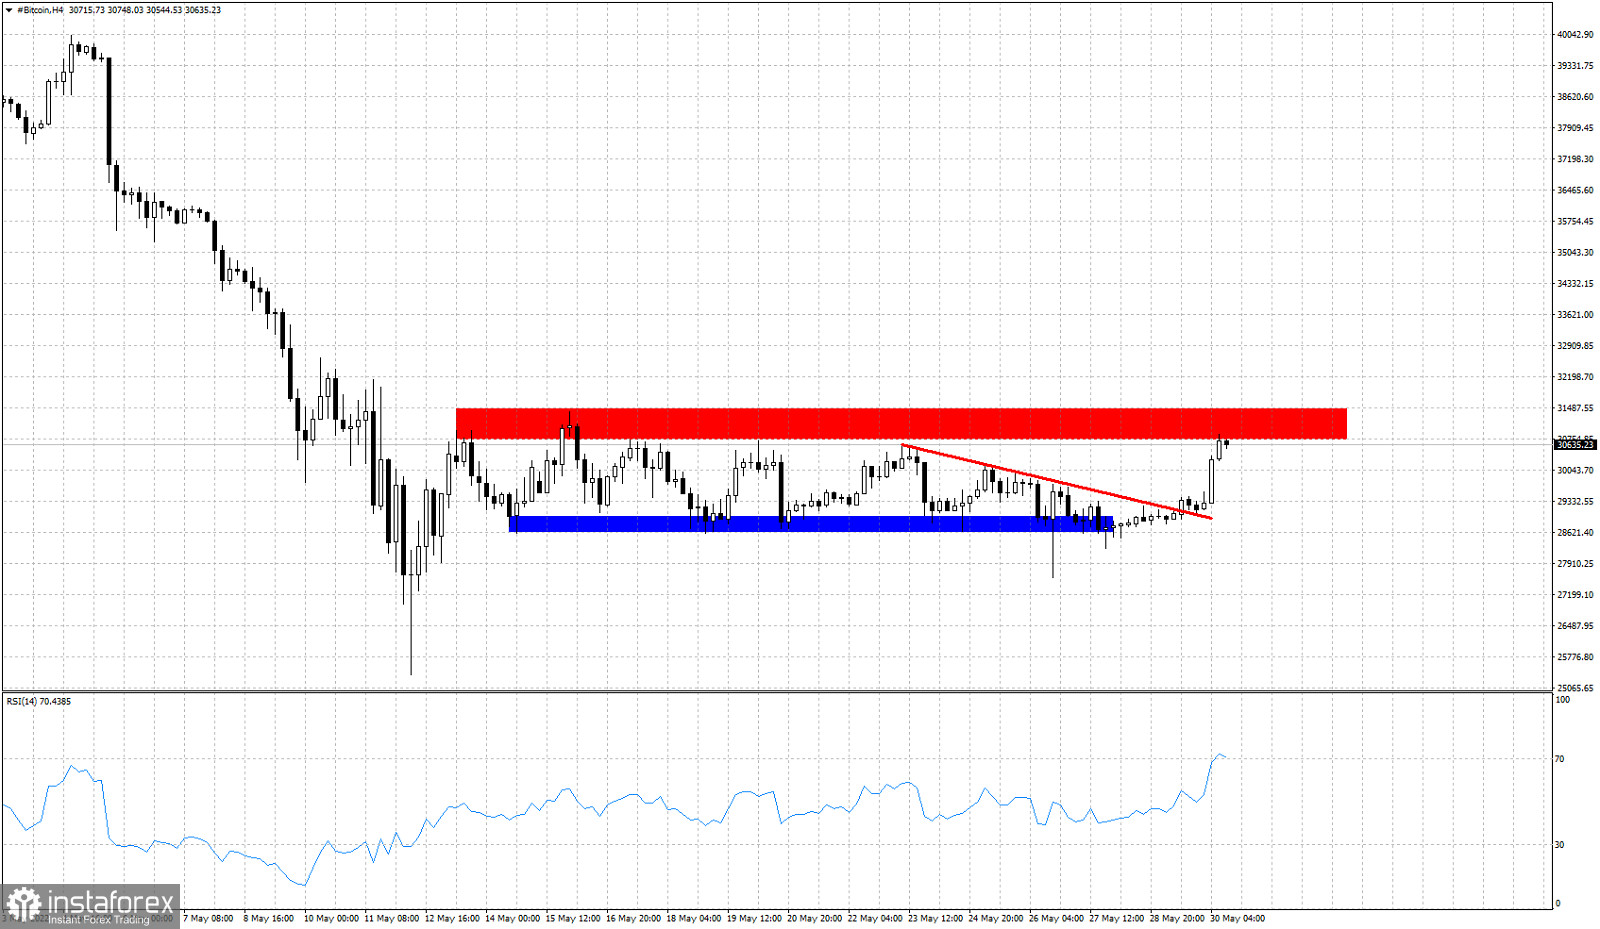
Blue rectangle - horizontal support
Red line -short-term resistance
Bitcoin broke above the short-term resistance trend line and that is why price bounced higher towards the horizontal resistance of $31,000-$31,500. Will price get rejected once again at current levels? As can be seen in the 4 hour chart, price never made a close below the horizontal support area, although it broke briefly below it. This price action confirms that importance of the horizontal support in the area. After four failed attempts, will Bitcoin bulls be able to finally break the resistance?