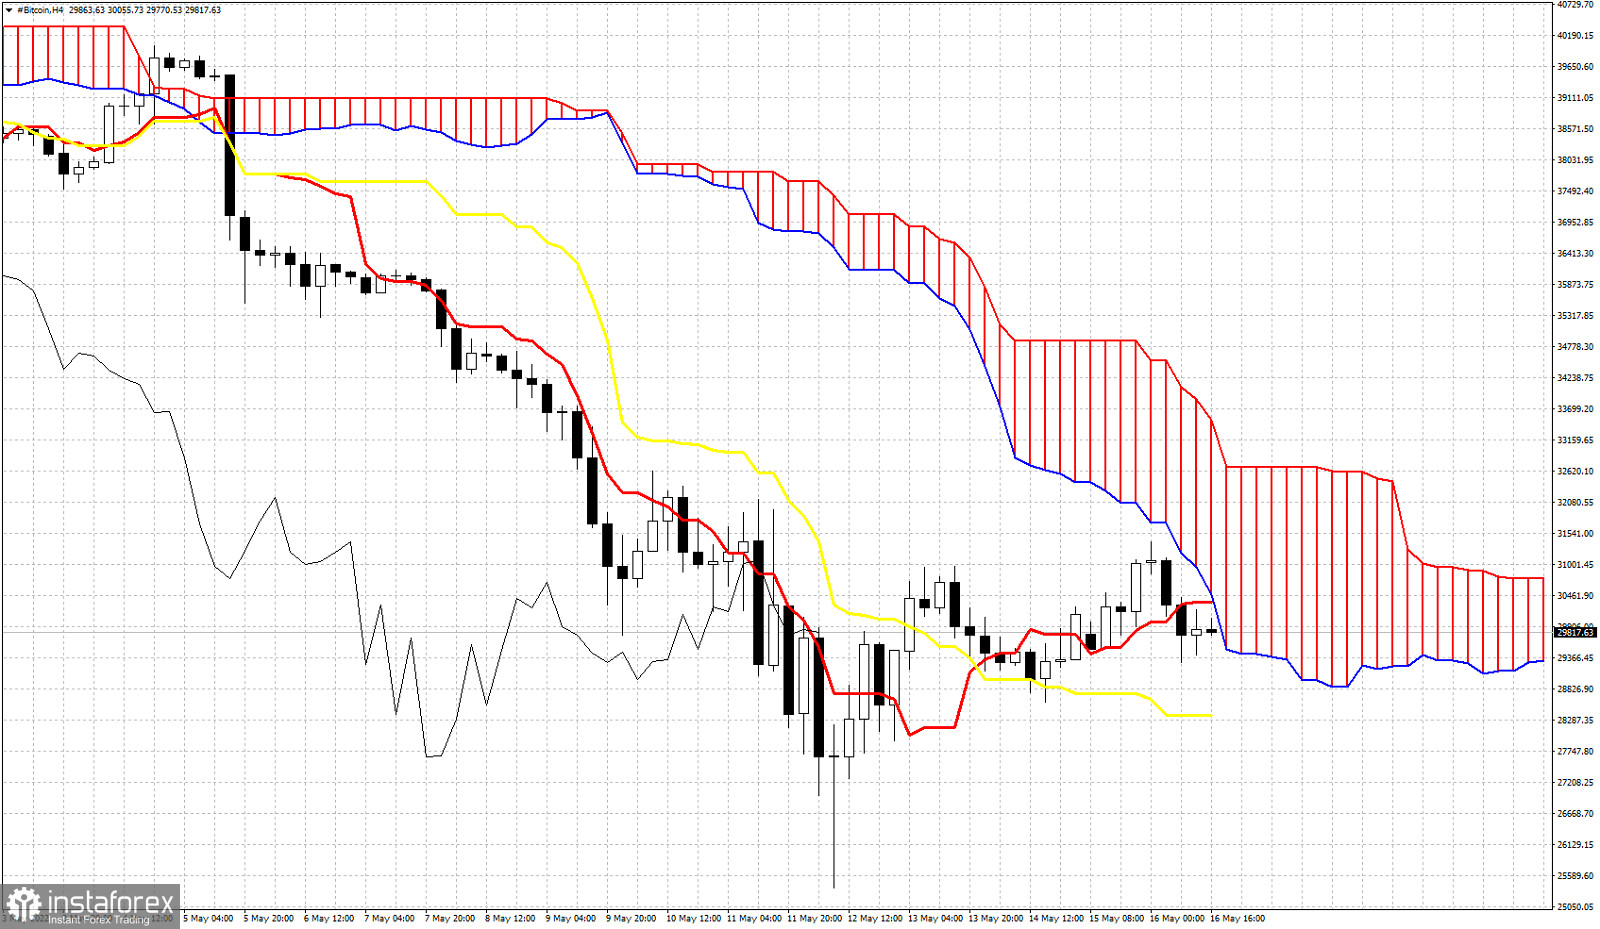
Bitcoin bounced higher from $25,000 where it reached last Thursday. Price so far has made a high around $31,400 but bulls do not look like they are strong enough to continue the upside bounce. Using the Ichimoku cloud indicator we see that Bitcoin has reached important cloud resistance in the 4h chart.

Bitcoin is showing rejection signs in the 4hour chart after reaching the cloud resistance. Price remains below the cloud thus 4 hour trend remains bearish according to the Ichimoku cloud indcator. Price has now broken again below the tenkan-sen (red line indicator). This is a sign of weakness. Next support is at $28,370 by the kijun-sen (yellow line indicator). Failure to hold above this level would be an added bearish signal, implying new lower lows to come. The Chikou span (black line indicator) remains below the candlestick pattern, confirming that we remain in a bearish trend.
*The market analysis posted here is meant to increase your awareness, but not to give instructions to make a trade

 English
 Русский
 Bahasa Indonesia
 Bahasa Malay
 ไทย
ไทย Español
 Deutsch
 Български
 Français
 Tiếng Việt
 中文
中文 বাংলা
বাংলা हिन्दी
 Čeština
 Українська
 Română

