Technical outlook:
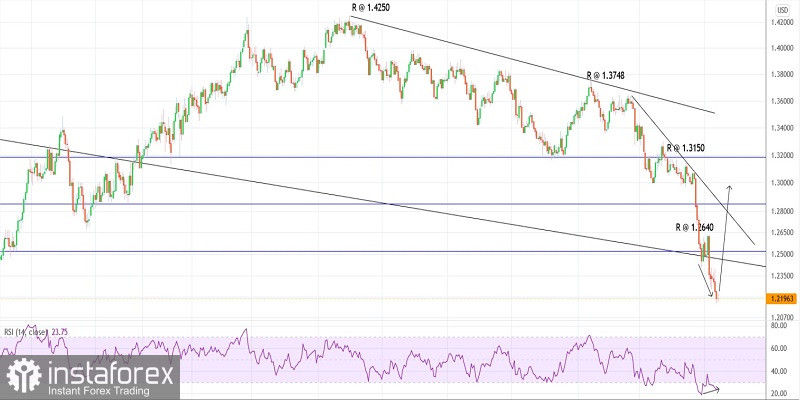
GBPUSD might have carved a potential bottom around the 1.2160 levels on Thursday. The currency pair is unfolding a Doji candlestick on its daily chart and a successful completion would indicate a potential trend reversal going forward. Bulls need to hold prices above 1.2160 and push them through the 1.2640 mark going forward.
GBPUSD has been declining since 1.4250 highs, posting a series of lower lows and lower highs. The entire structure between 1.4250 and 1.2160 looks corrective (zigzag) and might be complete or almost complete. Furthermore, prices might well be supported around current levels (1.2200-1.2300), which is the Fibonacci 0.618 retracement of an upswing on a larger scale.
GBPUSD has also produced a strong bullish divergence on the daily RSI as prices dropped from 1.2640 highs to 1.2160 lows. This could be seen as a potential trend reversal as traders prepare to initiate fresh long positions from current levels (1.2200-10). It would be interesting to see how prices react in the next 1-2 days.
Trading plan:
Potential rally through 1.2640 against 1.2100
Good luck!
 English
 Русский
 Bahasa Indonesia
 Bahasa Malay
 ไทย
ไทย Español
 Deutsch
 Български
 Français
 Tiếng Việt
 中文
中文 বাংলা
বাংলা हिन्दी
 Čeština
 Українська
 Română

