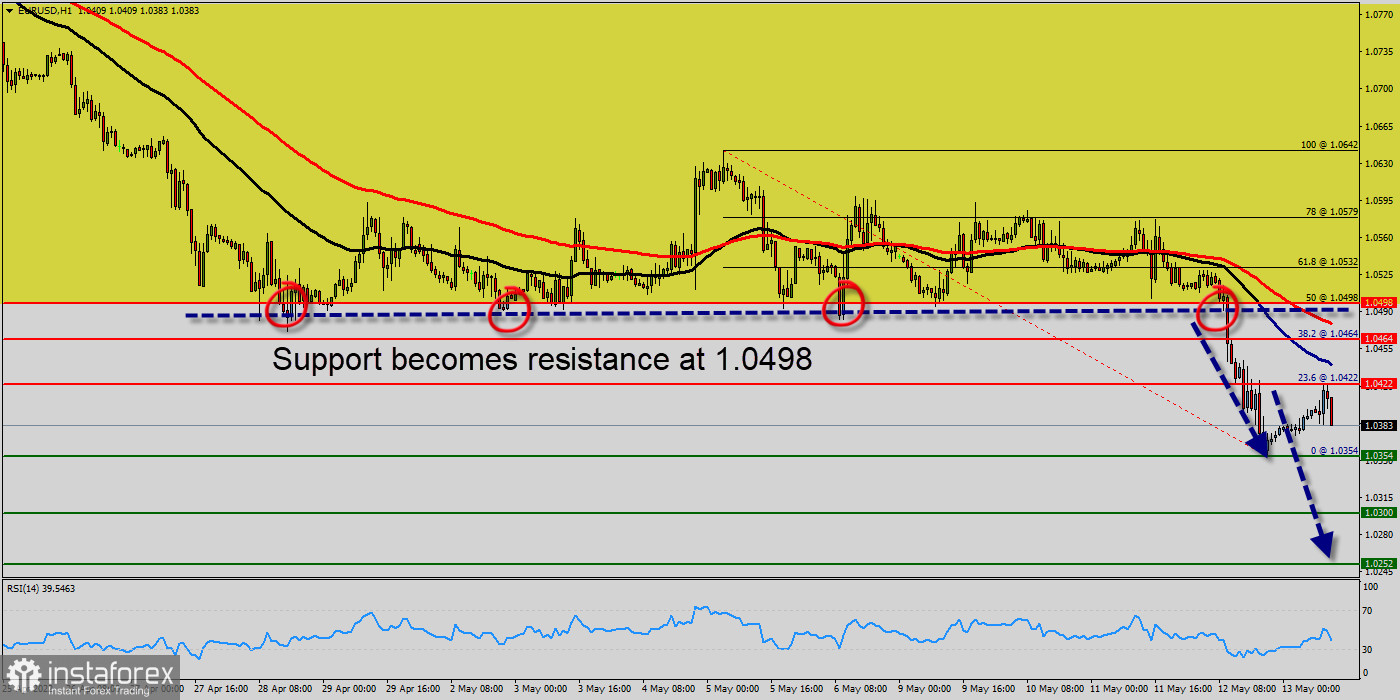
The EUR/USD pair dropped from the level of 1.0500 to the bottom around 1.0354. But the pair has rebounded from the bottom of 1.0354 to close at 1.0386.
Today, the first support level is seen at 1.0354, and the price is moving in a bearish channel now. Furthermore, the price has been set below the strong resistance at the level of 1.0498, which coincides with the 50% Fibonacci retracement level.
On the one-hour chart, the current rise will remain within a framework of correction. However, if the pair fails to pass through the level of 1.0498(major resistance), the market will indicate a bearish opportunity below the strong resistance level of 1.0498.
This resistance (1.0498) has been rejected several times confirming the downtrend. Additionally, the RSI starts signaling a downward trend.
As a result, if the EUR/USD pair is able to break out the first support at 1.0354, the market will decline further to 1.0300 in order to test the weekly support 2.
In the H1 time frame, the pair will probably go down because the downtrend is still strong. Consequently, the market is likely to show signs of a bearish trend.
Since there is nothing new in this market, it is not bullish yet. So, it will be good to sell below the level of 1.0422 with the first target at 1.0354 and further to 1.0300.
At the same time, the breakdown of 1.0500 will allow the pair to go further up to the levels of 1.0640 in order to retest the weekly top.
 English
 Русский
 Bahasa Indonesia
 Bahasa Malay
 ไทย
ไทย Español
 Deutsch
 Български
 Français
 Tiếng Việt
 中文
中文 বাংলা
বাংলা हिन्दी
 Čeština
 Українська
 Română

