Technical outlook:
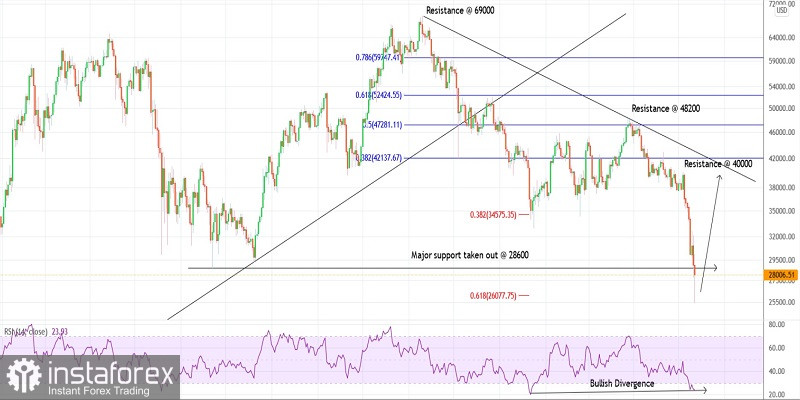
Bitcoin dropped through fresh swing lows around $25,500 on Thursday, slightly lower than the projected low at $28,000. The crypto seems to have carved a major bottom at least for the near term and is raising back through $28,300 at the time of writing. Bulls might remain poised to target $42,000 and $52,000 going forward.
Bitcoin is carving an effective Hammer/Pinbar candlestick pattern on the daily chart, which implies a potential reversal from here on. Furthermore, it has broken past a major past support around the $28,600 mark (July 2021), which implies a meaningful pullback ahead. Finally, the RSI on the daily chart is also producing a bullish divergence, enough grounds for a rally to materialize now.
Bitcoin faces immediate resistance at $40,000, followed by $48,000 while interim support is at $25,000 now. Bulls will be eyeing to break above $42,000 first, confirming the corrective wave underway. Potential remains for the pullback to reach the $52,000 mark, which is the Fibonacci 0.618 retracement of the entire drop between $69,000 and $25,500 respectively.
Trading plan:
Potential rally through $42,000 and $52,000 against $20,000
Good luck!
 English
 Русский
 Bahasa Indonesia
 Bahasa Malay
 ไทย
ไทย Español
 Deutsch
 Български
 Français
 Tiếng Việt
 中文
中文 বাংলা
বাংলা हिन्दी
 Čeština
 Українська
 Română

