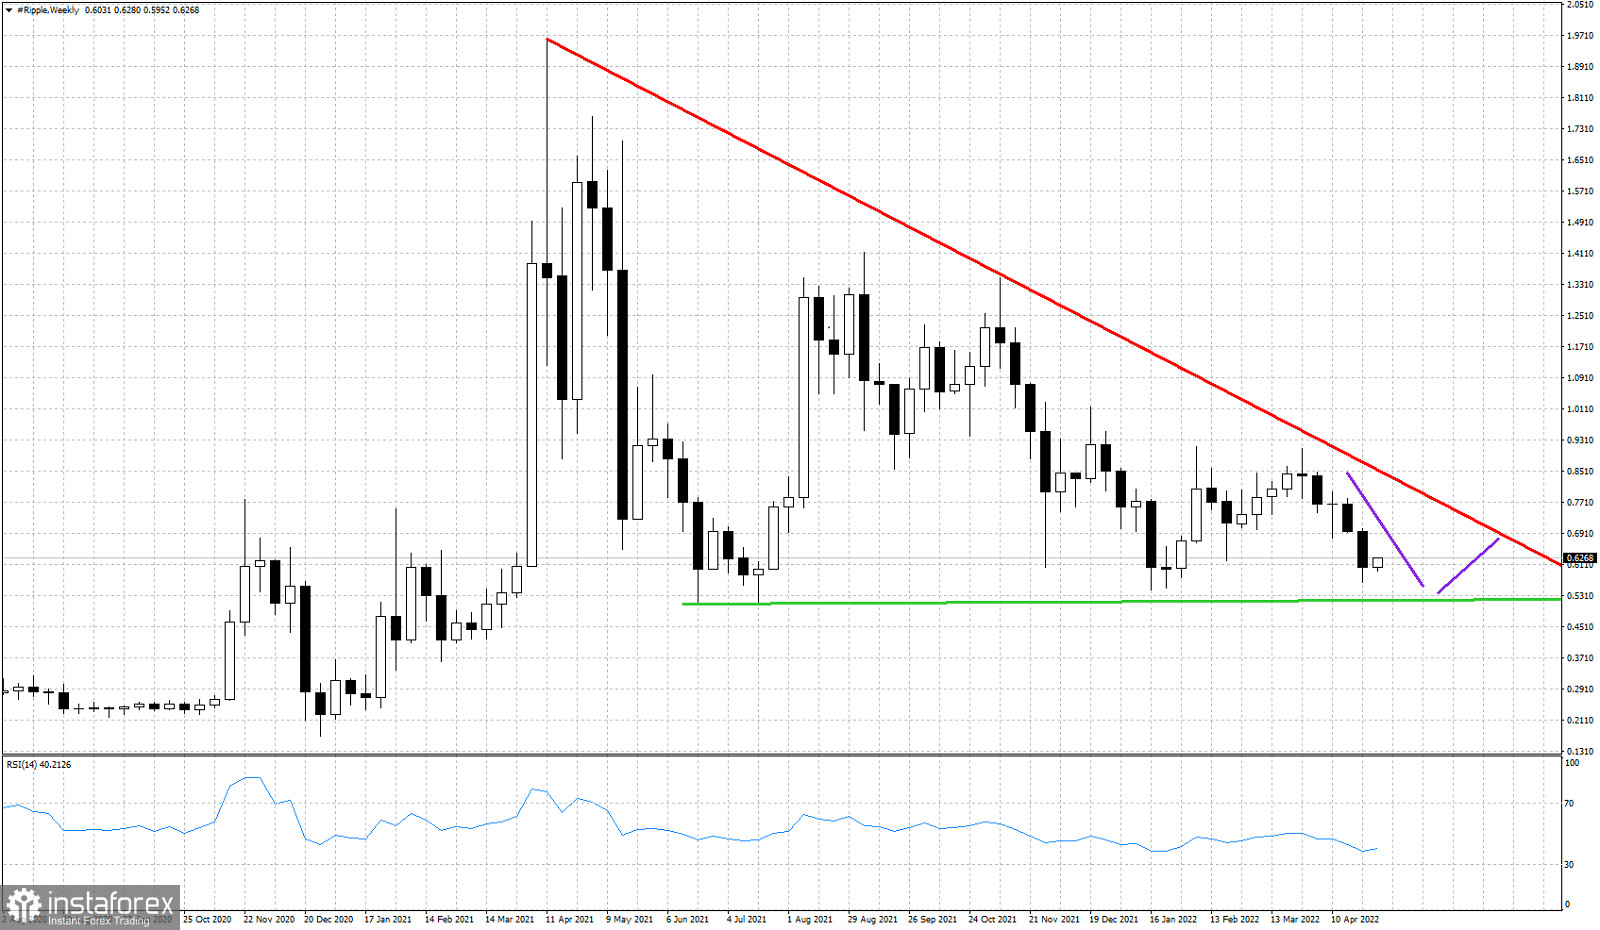
XRPUSD reached as low as $0.564 last week. 4 weeks ago when price was trading around $0.91 and got rejected at the upper triangle resistance, we warned traders that price was vulnerable to a move towards $0.50 where the major horizontal support is found and the lower triangle boundary.

Green line - horizontal support
Purple lines- expected path of price
XRPUSD has been under pressure for the past 5 weeks. April was not a good month for bulls as price has been making lower lows and lower highs with $0.50 as a magnet attracting price after the rejection at the red trend line resistance. Our purple line path has not changed and we continue to believe that as long as price holds above the key support at $0.50, we will continue to see XRPUSD move up and down within the triangle pattern.
 English
 Русский
 Bahasa Indonesia
 Bahasa Malay
 ไทย
ไทย Español
 Deutsch
 Български
 Français
 Tiếng Việt
 中文
中文 বাংলা
বাংলা हिन्दी
 Čeština
 Українська
 Română

