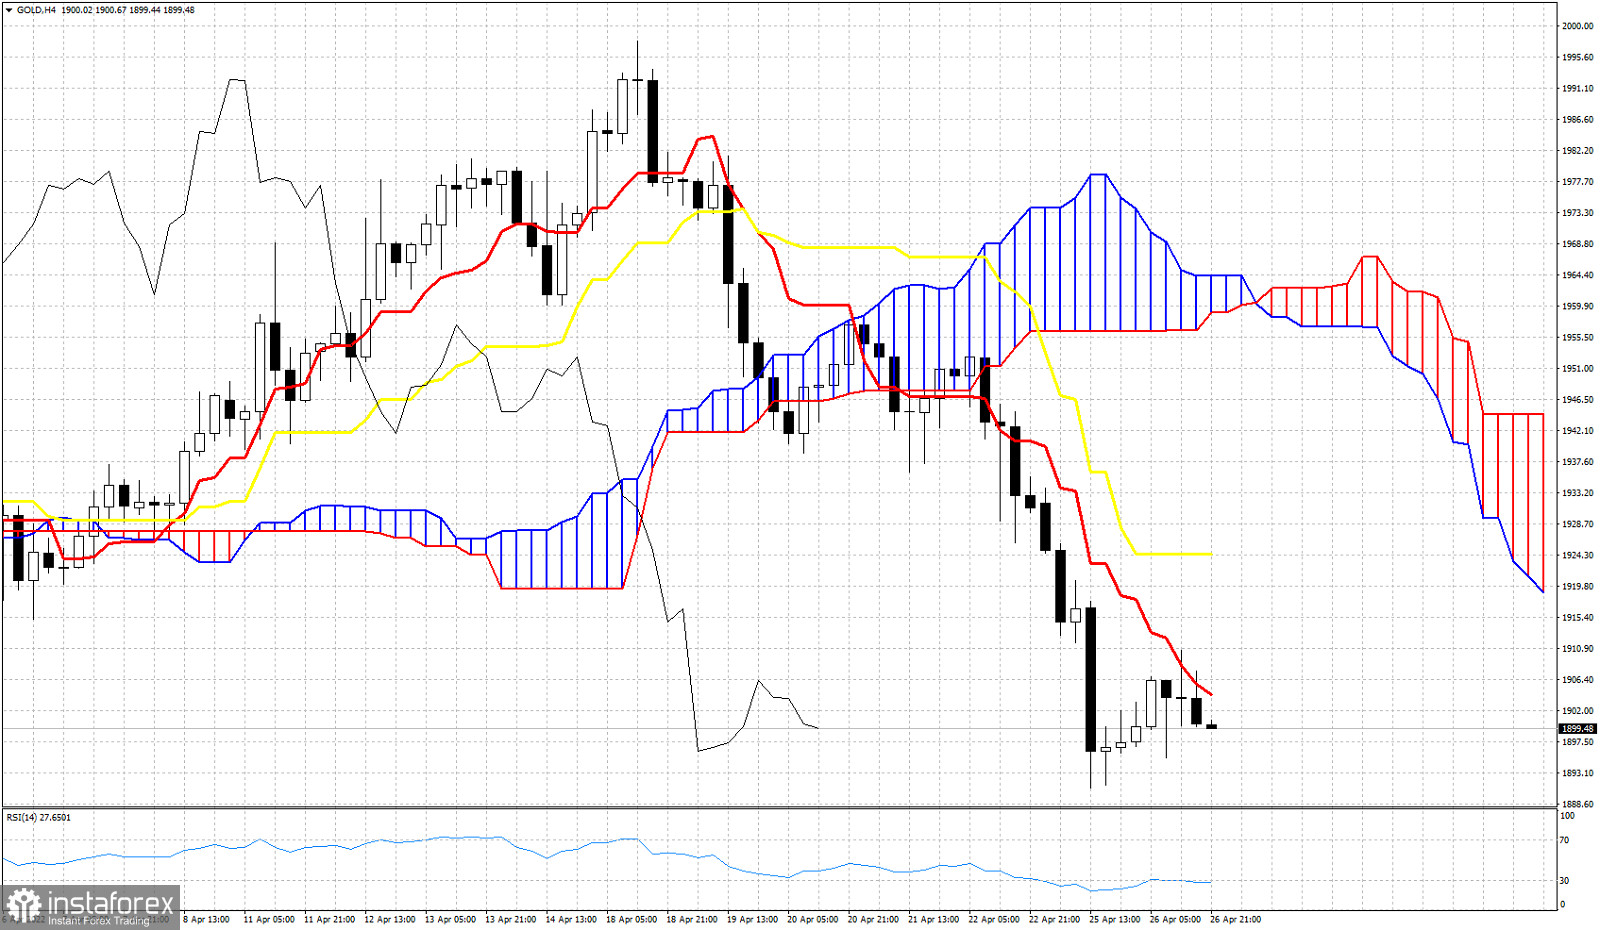
Gold price is in a short-term bearish trend according to the Ichimoku cloud indicator in the 4 hour chart. Price is well below the Kumo (cloud) and below both the tenkan-sen (red line indicator) and the kijun-sen (yellow line indicator).

 Relevance until
Gold price is in a short-term bearish trend according to the Ichimoku cloud indicator in the 4 hour chart. Price is well below the Kumo (cloud) and below both the tenkan-sen (red line indicator) and the kijun-sen (yellow line indicator).
