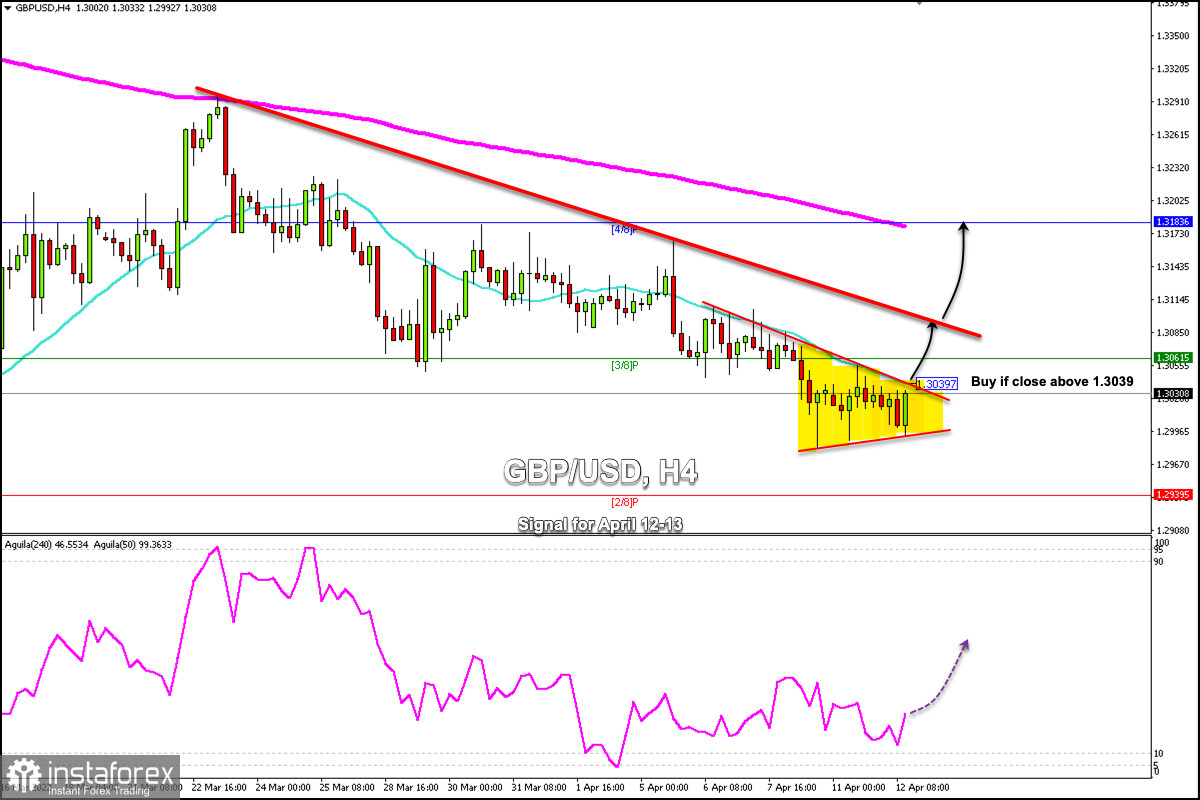
GBP/USD continues to trade around the psychological level of 1.3000. The British pound is forming a symmetrical triangle pattern below the 21 SMA located at 1.3039.
The US Dollar Index (USDX) is currently trading above the psychological level 100.00 and above the 21 SMA on the 1-hour chart.
The British pound is likely to rally if the dollar index falls below the level 100.00 and below the 21 SMA. If this forecast happens, it could be a good sign to buy above 1.3039 with the target at 1.3183.
The GBP/USD pair has managed to consolidate above 1.30 which is a sign that the bulls do not want to lose that level for a recovery in the next few days. If the pound consolidates above 1.3040 in the next few hours, it could mean a recovery and the pair could reach the top of the downtrend channel formed since March 22 around 1.3095
A sharp break of the downtrend channel located at 1.3085/90 could accelerate the upward movement and the price could reach the 4/8 Murray located at 1.3183. At the same level, the 200 EMA is located around 1.3175.
On the other hand, we should avoid buying if GBP/USD continues to trade below 1.3039. It is likely to continue the downward movement and could reach the support 2/8 Murray around 1.2939.
Our trading plan for the next few hours is to wait for a close above 1.3940 to buy with targets at 1.3085 and 1.3183 (4/8 Murray). The eagle indicator is in the oversold zone showing a slight bullish signal.
 English
 Русский
 Bahasa Indonesia
 Bahasa Malay
 ไทย
ไทย Español
 Deutsch
 Български
 Français
 Tiếng Việt
 中文
中文 বাংলা
বাংলা हिन्दी
 Čeština
 Українська
 Română

