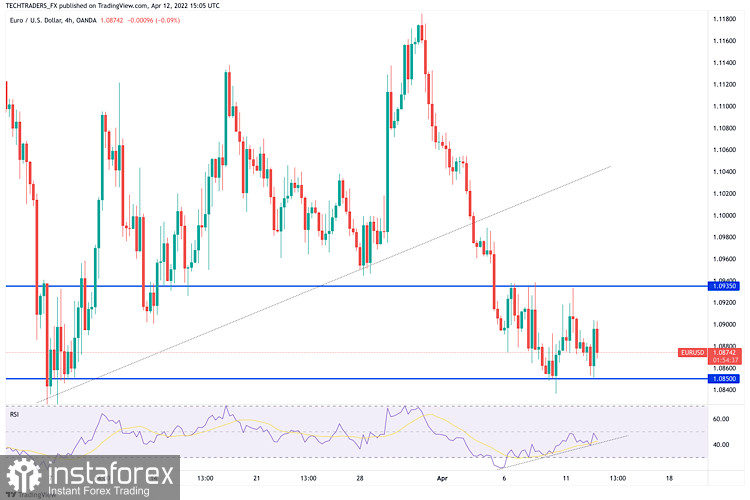
EUR/USD has staged a rebound as the greenback lost interest after the US inflation data, which showed that the Core CPI rose at a slightly softer pace than expected in March. The pair, however, lost its bullish momentum after rising above 1.0900 and erased its daily gains.
EUR/USD was trading at around 1.0890 heading into the US opening, and the daily chart suggests there's room for deeper falls. The pair is down for a second consecutive day, meeting intraday sellers around a bearish 20 SMA as the longer moving averages maintain their bearish slopes far above the longer ones. The Momentum indicator is directionless around its midline, although the RSI heads firmly lower at around 36.
The 4-hour chart also supports a bearish continuation, as the pair is struggling to advance beyond a mildly bearish 20 SMA, as the longer moving averages accelerate their slides above the shorter one.
Technical indicators remain directionless, the Momentum around its midline and the RSI at around 41. The pair could break below the year low, at 1.0805, on a bearish acceleration through 1.0835, the immediate support level.
Support levels: 1.0835 1.0800 1.0760
Resistance levels: 1.0930 1.0965 1.1020
 English
 Русский
 Bahasa Indonesia
 Bahasa Malay
 ไทย
ไทย Español
 Deutsch
 Български
 Français
 Tiếng Việt
 中文
中文 বাংলা
বাংলা हिन्दी
 Čeština
 Українська
 Română

