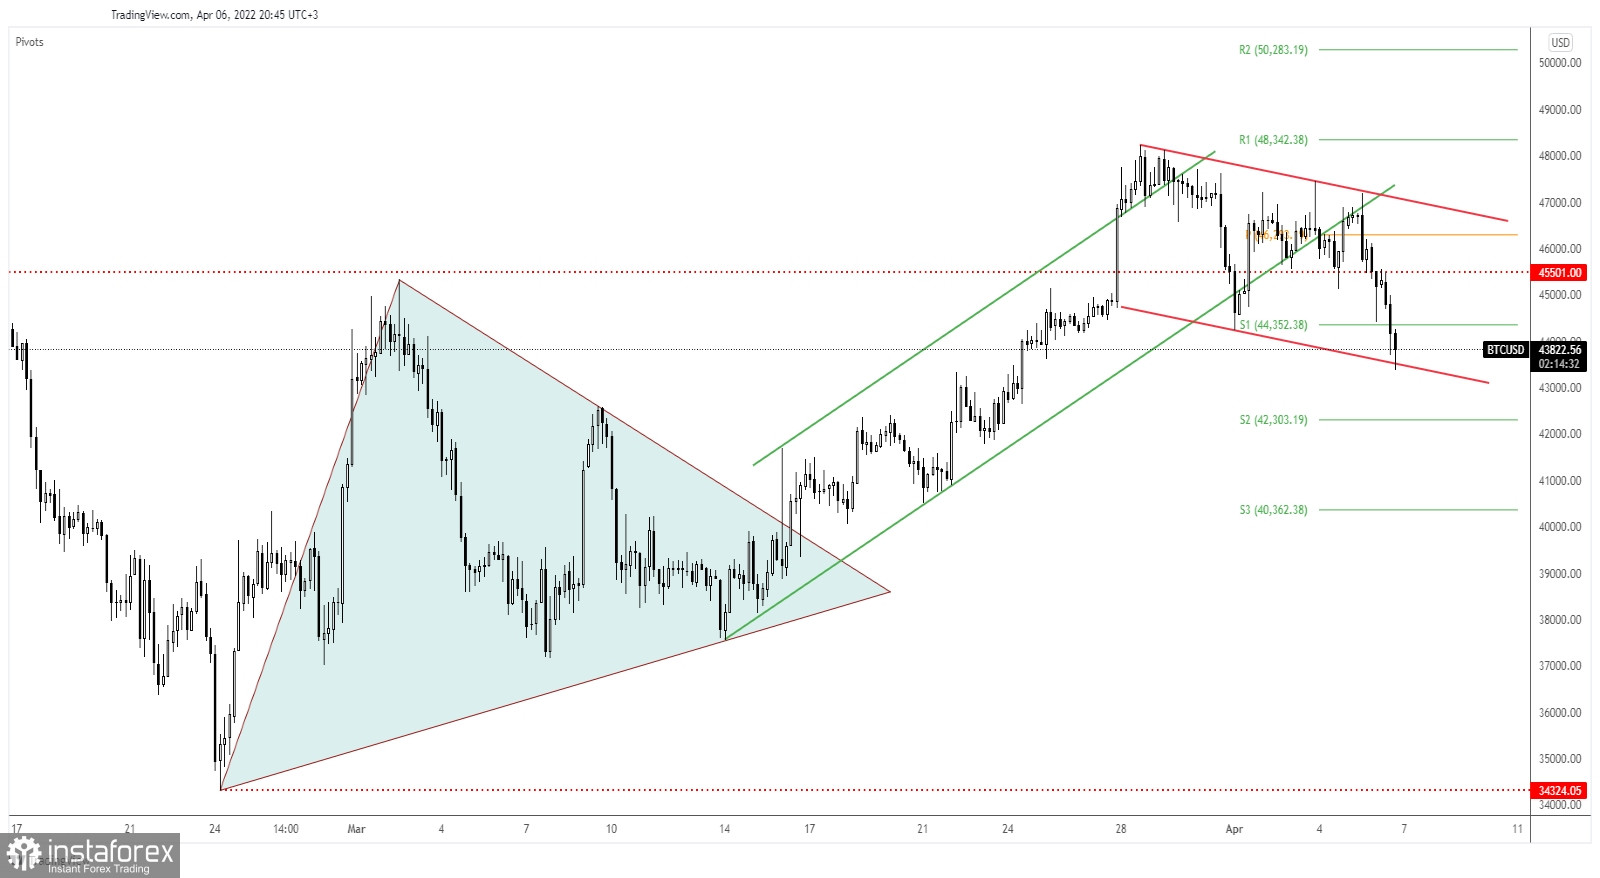
The price of bitcoin is trading in the red at 43,904 at the time of writing. The cryptocurrency is in a corrective phase after registering a strong swing higher. Technically, a temporary decline was somehow expected. The price action developed a down channel, a flag formation that may represent an upside continuation pattern.
In the last 24 hours, BTC/USD is down by 4.48% and by 7.43% in the last 7 days. Bitcoin's drop forced the altcoins to drop as well.
BTC/USD Upside Continuation Formation!

BTC/USD escaped from the up-channel signaling potential downside movement. Now, it reached the flag's downside line which stands as a downside obstacle. False breakdowns below this obstacle may announce a potential bullish momentum.
Technically, a valid breakdown below the channel's downside line could open the door for a larger drop. The current flag could represent a bullish continuation pattern. Still, this is far from being confirmed.
Bitcoin Outlook!
After retesting the broken uptrend line, BTC/USD was expected to drop. Now, it has reached support. Staying above the channel's downside line may signal a new leg higher. Still, only a valid breakout above the flag's resistance, above the downtrend line could confirm an upside continuation.
 English
 Русский
 Bahasa Indonesia
 Bahasa Malay
 ไทย
ไทย Español
 Deutsch
 Български
 Français
 Tiếng Việt
 中文
中文 বাংলা
বাংলা हिन्दी
 Čeština
 Українська
 Română

