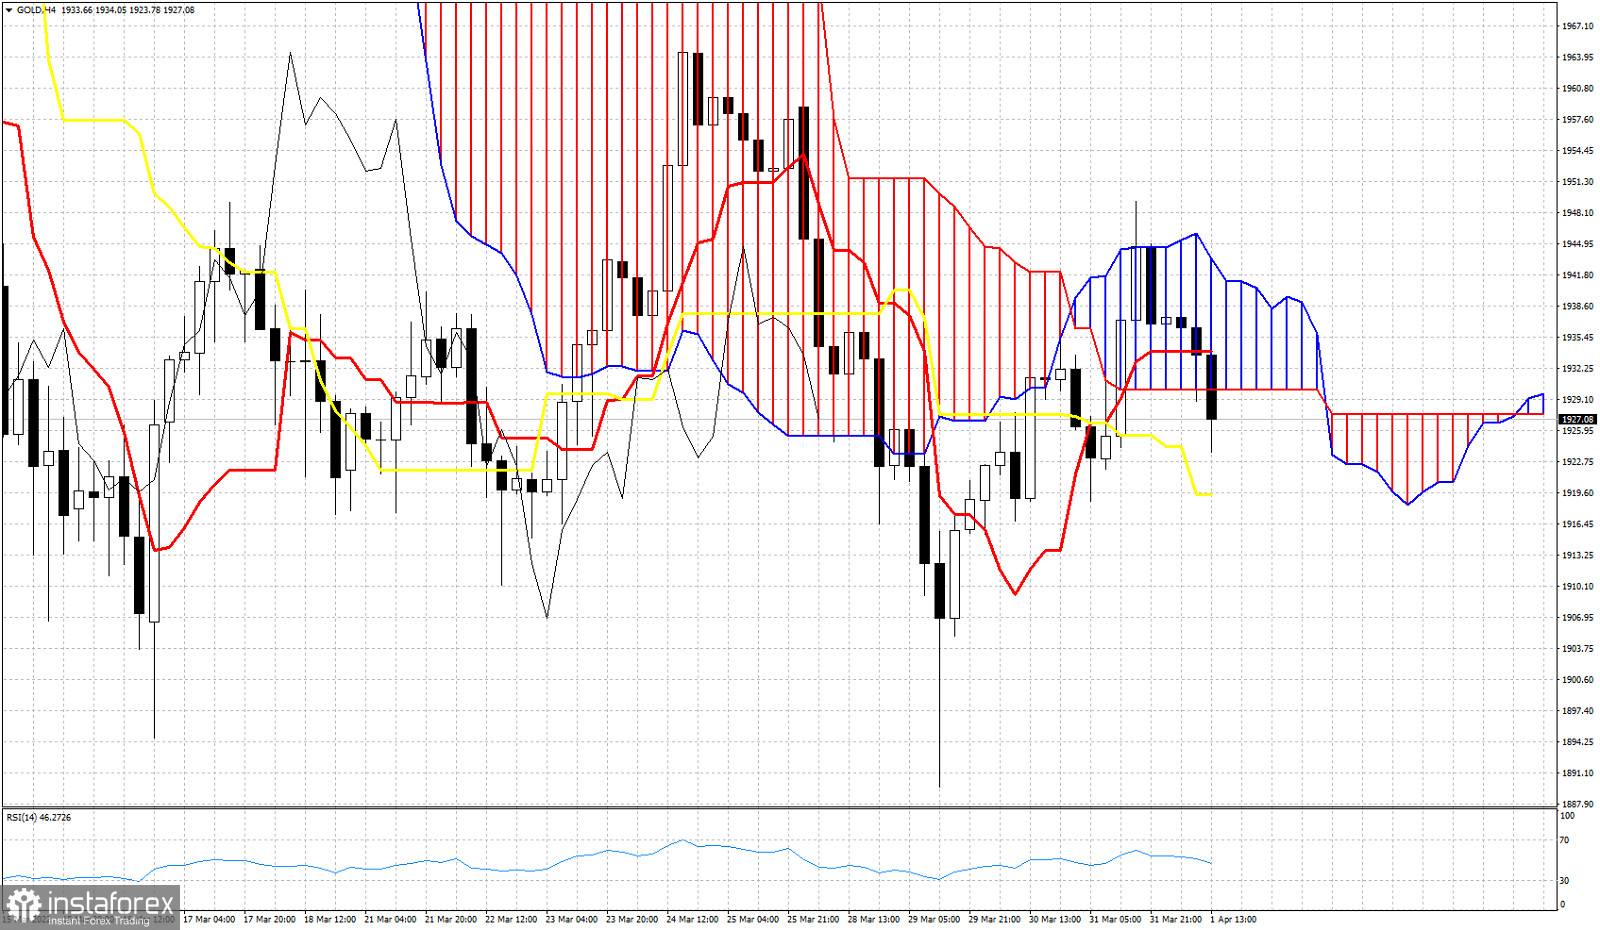
Gold price continues to trade below the Ichimoku cloud in the 4 hour chart. Price remains vulnerable to the downside. So far we have some mixed signals by the Ichimoku indicator and there is no clear picture if bulls or bears have the upper hand. While price remains below the Kumo (cloud), the tenkan-sen (red line indicator) has crossed above the kijun-sen (yellow line indicator) indicating a potential reversal.

Yesterday Gold price entered the Kumo and tried to push above it. Price got rejected at the upper cloud boundary resistance at $1,944. The rejection lead to a move below the cloud today. Support for the short-term is key at the kijun-sen at $1,919. Bulls need to defend this level, otherwise price will be vulnerable to a move towards the major low of $1,900. Resistance by the cloud is found between $1,930-44. Bulls need to break above this resistance area in order to reclaim control of the trend. The Chikou span (black line indicator) remains below the candlestick pattern. This is not a bullish sign. If price however manages to push above $1,944, then the Chikou span will also have broken its resistance providing a sign of strength.
*The market analysis posted here is meant to increase your awareness, but not to give instructions to make a trade

 English
 Русский
 Bahasa Indonesia
 Bahasa Malay
 ไทย
ไทย Español
 Deutsch
 Български
 Français
 Tiếng Việt
 中文
中文 বাংলা
বাংলা हिन्दी
 Čeština
 Українська
 Română

