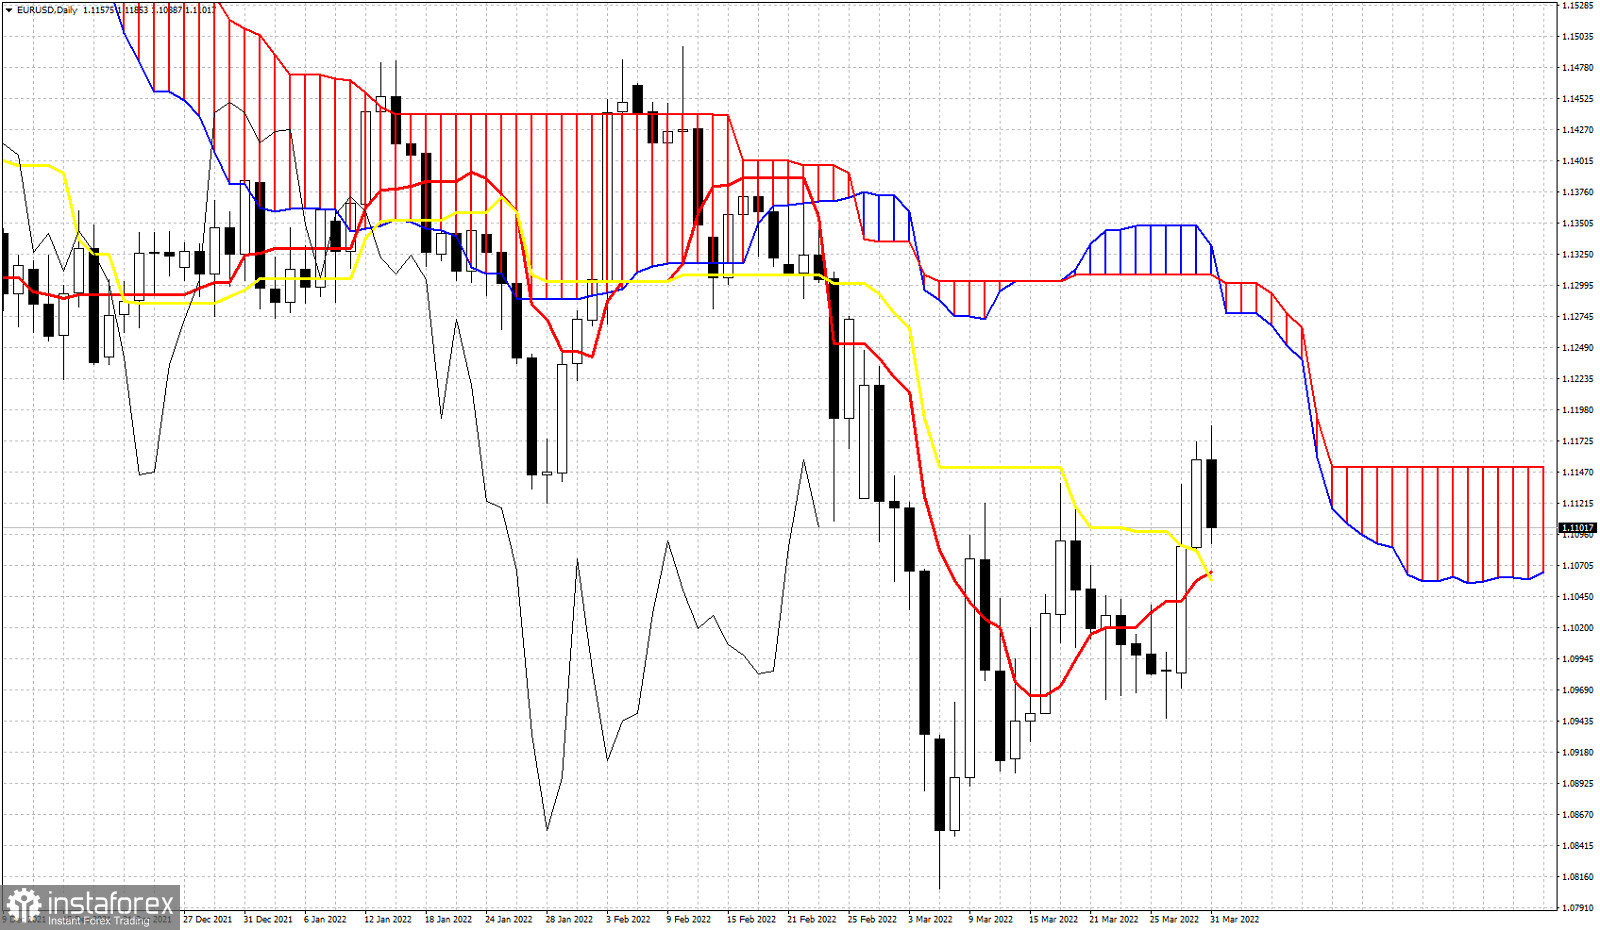
EURUSD is trading around 1.11 having broken above both the tenkan-sen and the kijun-sen. On a daily basis price remains in a bearish trend as it located below the Kumo, however there are some signs showing a possible reversal might be on its way.

In the 4 hour chart price is above the Kumo. This means that short-term trend is bullish. In the Daily chart price is still below the Kumo but has broken above the kijun-sen (yellow line indicator). Now the tenkan-sen (red line indicator) is crossing above the kijun-sen. This will be an important sign of strength as well. However in order to consider a trend change on a daily basis, bulls need to push price above the Ichimoku cloud resistance, Currently this happens if price were to break above 1.13. Our expectations since price was trading around 1.08 was for a bounce towards 1.12-1.13. We are nearly there so traders need not be too optimistic. If bulls manage to form a higher low towards the support of 1.1065, then we could see a strong move to break the Daily Kumo.
*The market analysis posted here is meant to increase your awareness, but not to give instructions to make a trade

 Relevance until