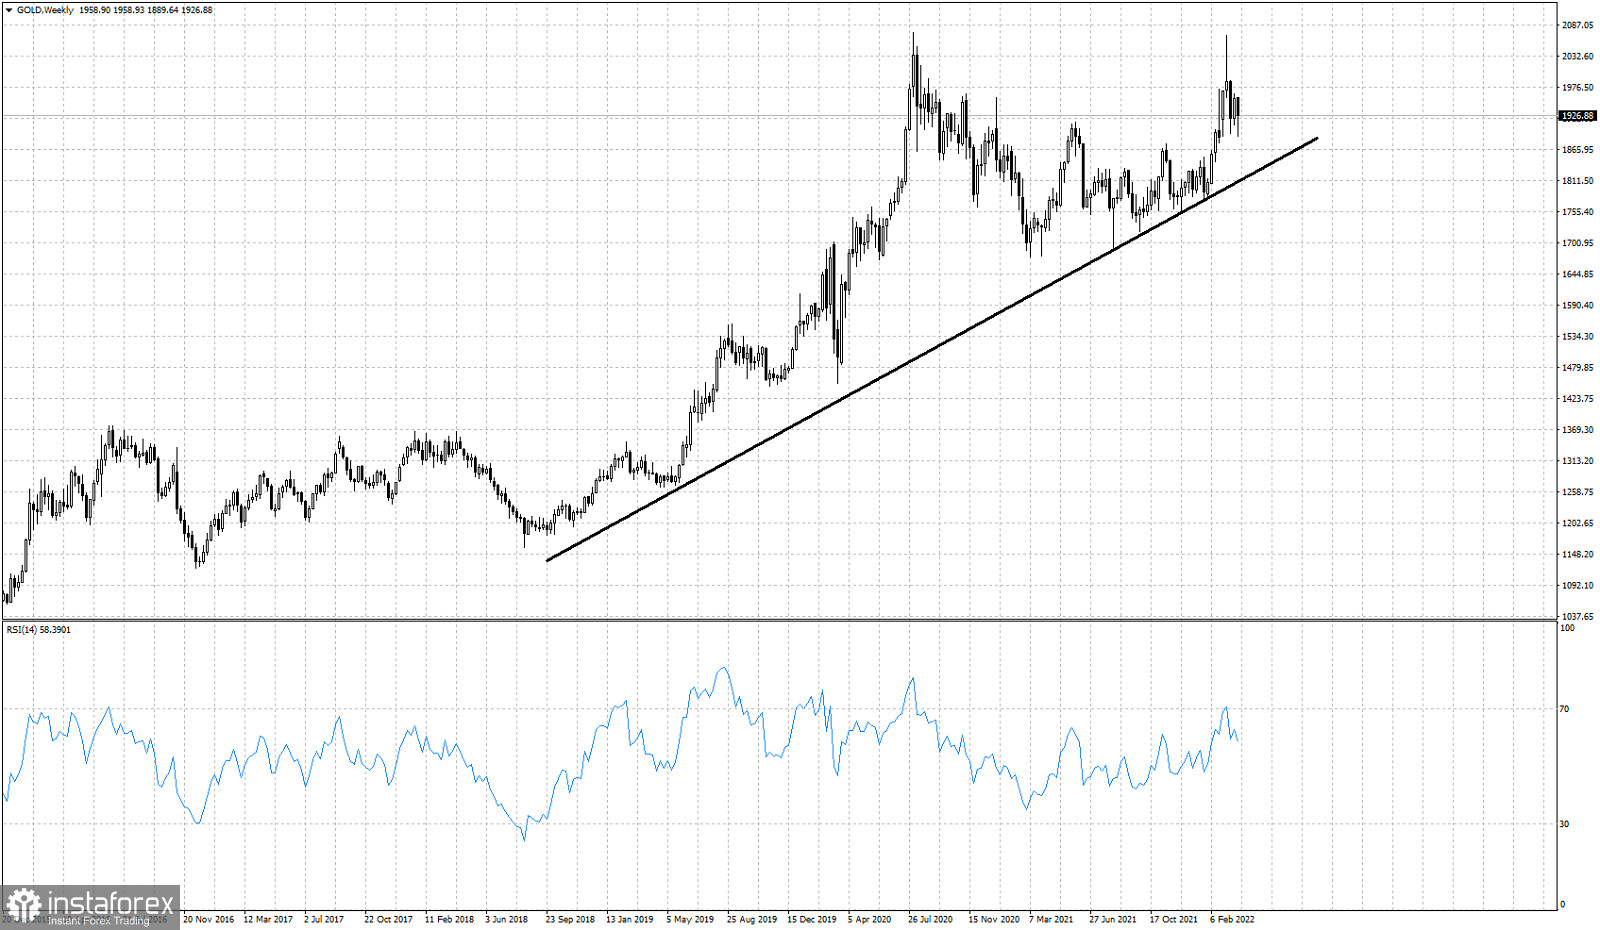
Gold price is trading above $1,900. Gold bulls made an attempt three weeks ago to break above Gold's all time high of $2,074 but they only managed to make a lower high. Gold trend remains bullish but we see some signs of vulnerability towards $1,820.

Gold price is trading above the black support trend line. As long as this is the case, bulls have the upper hand on a weekly basis. Price made a long upper tail in the weekly candlestick that reached as high as $2,069. This was a bearish candlestick. This implies that price is vulnerable to a move towards $1,820 and the black support trend line. Traders need to be cautious. Recent high of $1,964 will define the short-term trend. So as long as price is below that level, chances favor a weekly decline towards the black trend line.
 English
 Русский
 Bahasa Indonesia
 Bahasa Malay
 ไทย
ไทย Español
 Deutsch
 Български
 Français
 Tiếng Việt
 中文
中文 বাংলা
বাংলা हिन्दी
 Čeština
 Українська
 Română

