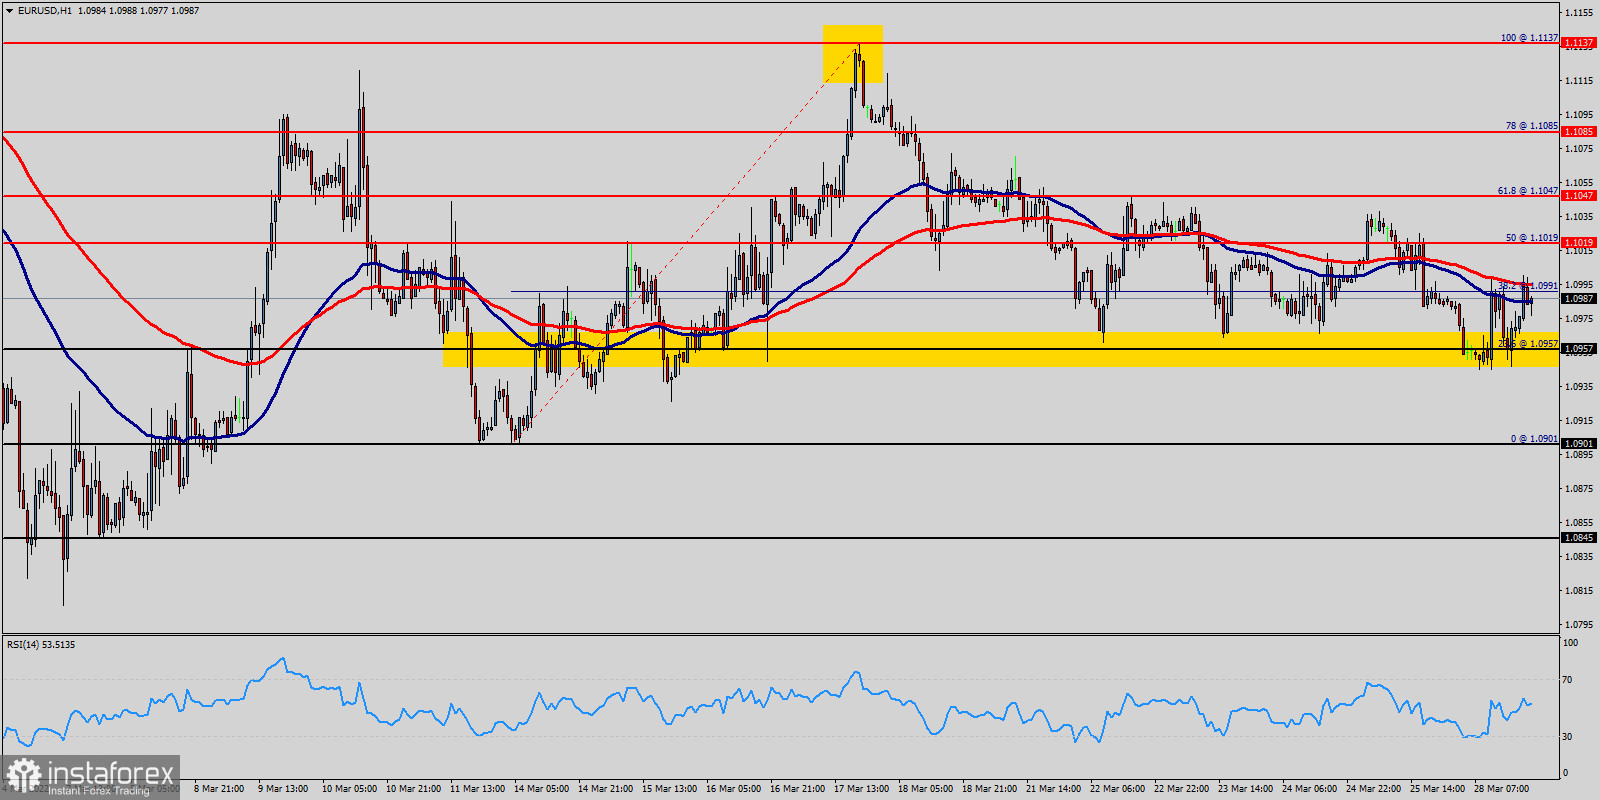
The EUR/USD pair is following a bullish rebound over the past few days, Euro has once again reached the high resistance spot of 1.0990.
The hourly chart shows that the price has been making higher highs and higher lows, which is a strong indicator of a firm bullish recovery based on the price action patterns around the area of 1.0957 - 1.0900.
The EUR/USD pair has broken the ceiling of the falling trend in the medium long term, which indicates a slower first falling rate.
The currency has given a positive signal from the double bottom formation by a break up through the resistance at 1.0991. Further rise to 1.1019 or more is signaled.
The short term momentum of the currency is strongly positive, with RSI above 50. Moreover, the RSI is becoming to signal a downward trend, as the trend is still showing strong above the moving average (100) and (50). This indicates increasing optimism among investors and further price increase for Euro.
The EUR/USD pair is currently aiming for another attempt to break the critical resistance level of 1.0991. If it succeeds, breaching above the 1.0991 supply zone could be imminent and a possible attempt to retest 1.1047 as the first target. - Please check out the market volatility before investing, because the sight price may have already been reached and scenarios might have become invalidated.
On the other hand, if the EUR/USD pair fails to break through the resistance level of 1.1047 today, the market will decline further to 1.0957. The pair is expected to drop lower towards at least 1.0901 with a view to test the weekly bottom. Also, it should be noted that the weekly bottom will act as major support today.
 English
 Русский
 Bahasa Indonesia
 Bahasa Malay
 ไทย
ไทย Español
 Deutsch
 Български
 Français
 Tiếng Việt
 中文
中文 বাংলা
বাংলা हिन्दी
 Čeština
 Українська
 Română

