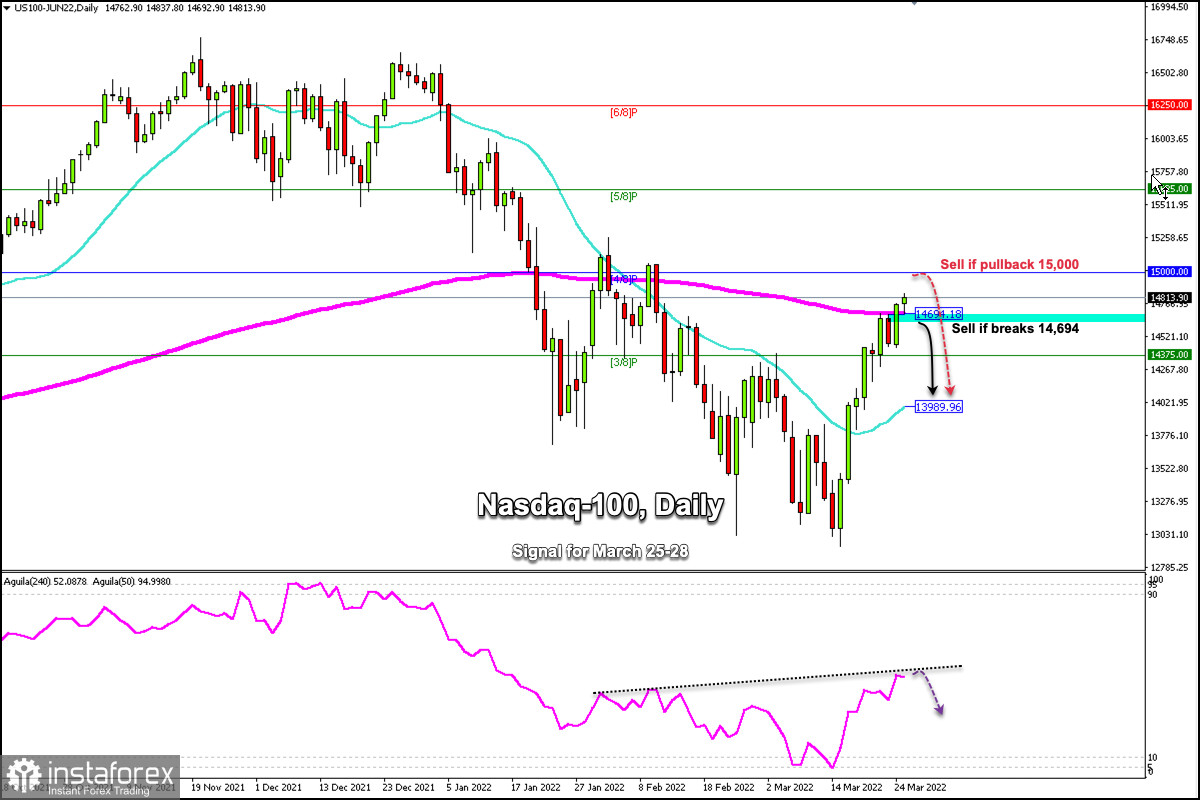
The Nasdaq 100 (#NDX) accumulates strong bullish momentum for eight days straight. At the beginning of the American session, the index is trading above the 200 EMA with a positive bias, but on H4 and H1 charts it is overbought.
As long as it remains above the 200 EMA, it is expected to continue its upward movement and it can reach 15,000 points.
The eagle indicator has a resistance zone. If the Nasdaq cannot break above the psychological level of 15,000 points, a technical correction may probably occur in the next few days.
Additionally, with a daily close below the 200 EMA, it could resume its downtrend and drop towards the 21 SMA located at 13,989.
The appetite for risk has improved which has made the Nasdaq obtain favorable number of returns in recent days. However, it could turn the tide due to a change towards negative sentiment among investors.
It seems that the market has now become accustomed to the conflict in Ukraine that is part of the reason for the recovery on Wall Street. Markets hate shocks or unknowns, but risk aversion could hurt good performance and the index could drop after this rally.
Our trading plan is to sell below the 200 EMA located at 14,700 with targets towards the 21 SMA at 13,989. The eagle indicator is in a resistance zone, for which there could be a technical correction in the next few hours.
 English
 Русский
 Bahasa Indonesia
 Bahasa Malay
 ไทย
ไทย Español
 Deutsch
 Български
 Français
 Tiếng Việt
 中文
中文 বাংলা
বাংলা हिन्दी
 Čeština
 Українська
 Română

