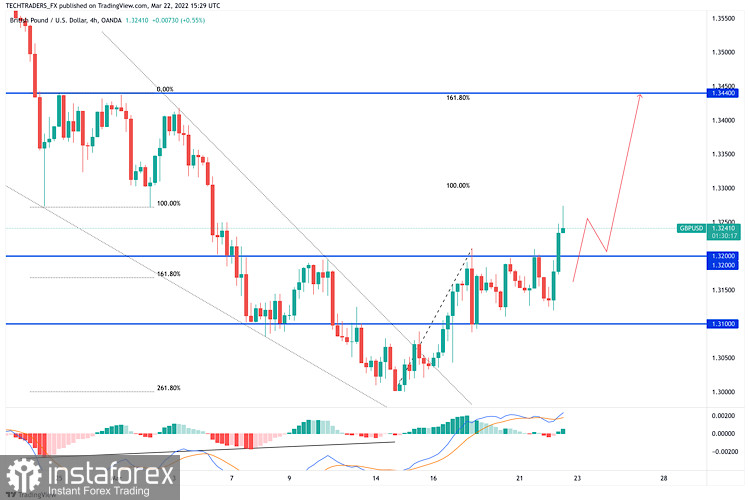
GBP/USD maintains its bullish momentum in the American session, trading at its highest level in two weeks above 1.3250. The risk-positive market environment, as reflected by rising European and US stock indices, seems to be weighing on the dollar.
On the four-hour chart, GBP/USD is testing the 100-period SMA, which forms interim resistance at 1.3180 ahead of the critical 1.3200 (psychological level, Fibonacci 50% retracement of the latest downtrend) hurdle.
Meanwhile, the Relative Strength Index (RSI) indicator is holding above 50 on the same chart, suggesting that buyers are looking to take control of the pair's action. In case 1.3200 level turns into support, the next bullish target could be seen at 1.3250 (Fibonacci 61.8% retracement).
On the downside, 1.3150 (Fibonacci 38.2% retracement) aligns as first support before 1.3100 (50-period SMA, Fibonacci 23.6% retracement, psychological level).
 English
 Русский
 Bahasa Indonesia
 Bahasa Malay
 ไทย
ไทย Español
 Deutsch
 Български
 Français
 Tiếng Việt
 中文
中文 বাংলা
বাংলা हिन्दी
 Čeština
 Українська
 Română

