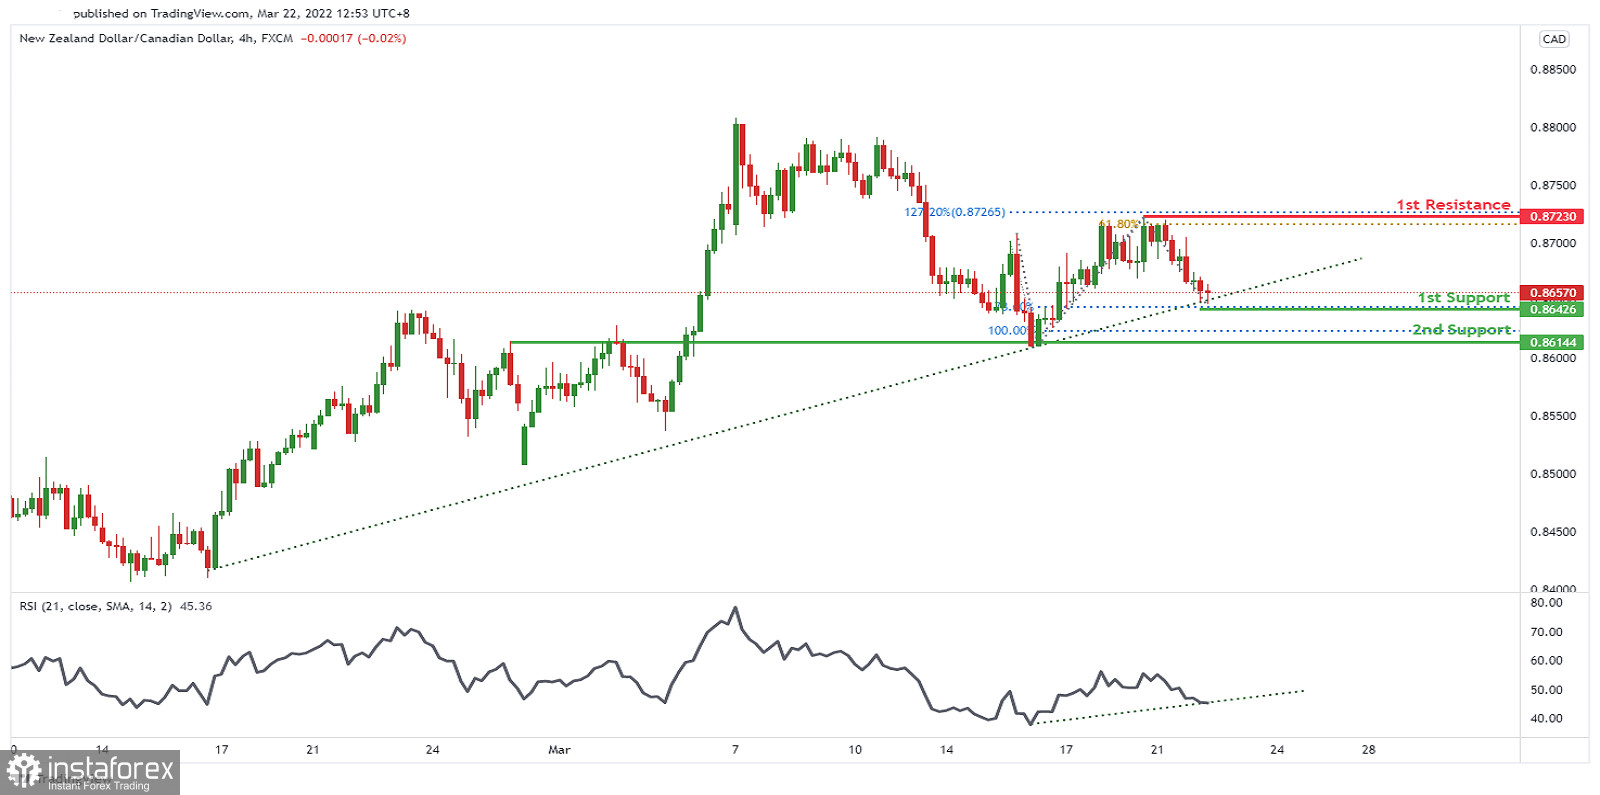
On the H4, price is abiding to the ascending trendline. Price is near 1st support level of 0.86426 in line with 78.6% Fibonacci projection. Price can move towards the 1st resistance level of 0.87230 which is in line with 127.2% Fibonacci extension and 61.8% Fibonacci projection. Our bullish bias is supported by the how price is expected to bounce off the support of the RSI indicator. Alternatively, price might dip to the 2nd support level at 0.86144 which is in line with 100% Fibonacci projection, along with a graphical pullback support.
Trading Recommendation
Entry: 0.86426
Reason for Entry: 78.6% Fibonacci projection.
Take Profit: : 0.87230
Reason for Take Profit: 127.2% Fibonacci extension and 61.8% Fibonacci projection.
Stop Loss: 0.86144
Reason for Stop Loss:
100% Fibonacci projection, along with a graphical pullback support.
 English
 Русский
 Bahasa Indonesia
 Bahasa Malay
 ไทย
ไทย Español
 Deutsch
 Български
 Français
 Tiếng Việt
 中文
中文 বাংলা
বাংলা हिन्दी
 Čeština
 Українська
 Română

