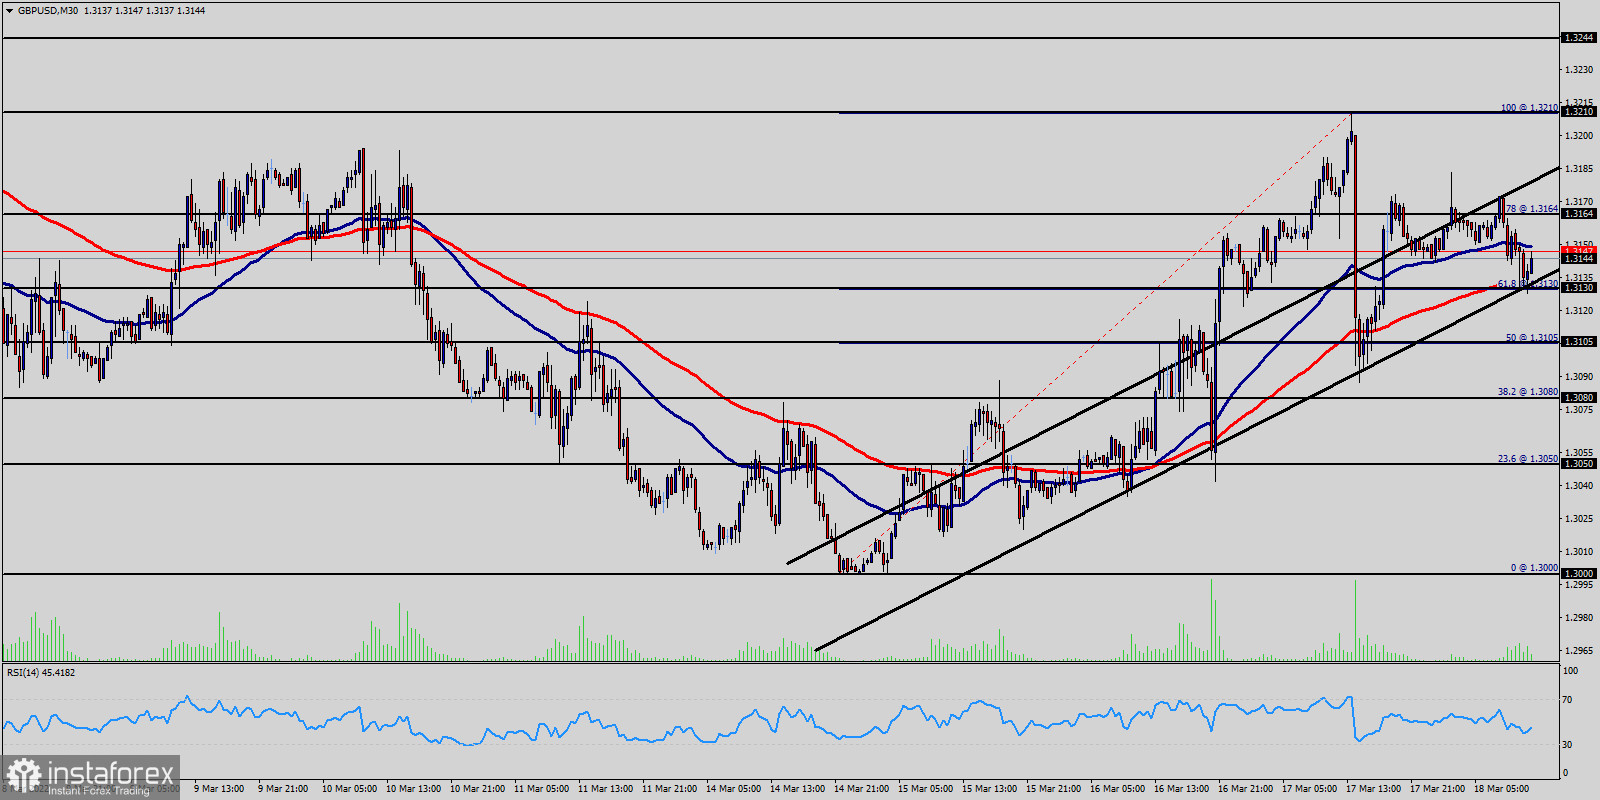
The GBP/USD pair broke resistance at 1.3130 which turned into strong support yesterday. This level coincides with 61.8% of Fibonacci retracement which is expected to act as major support today.
Equally important, the RSI is still signaling that the trend is upward, while the moving average (100) is headed to the upside. Accordingly, the bullish outlook remains the same as long as the EMA 100 is pointing to the uptrend. This suggests that the pair will probably go above the daily pivot point (1.3130) in the coming hours.
The GBP/USD pair will demonstrate strength following a breakout of the high at 1.3130. Consequently, the market is likely to show signs of a bullish trend.
The level of 1.3130 is expected to act as major support today. Currently, the price is moving in a bullish channel. This is confirmed by the RSI indicator signaling that we are still in a bullish market.
From this point, we expect the GBP/USD pair to continue moving in the bullish trend from the support level of 1.3130 towards the target level of 1.3210.
If the pair succeeds in passing through the level of 1.3210, the market will indicate the bullish opportunity above the level of 1.3210 so as to reach the second target at 1.3244.
At the same time, if the GBP/USD pair is able to break out the level of 1.3105, the market will decline further to 1.3050 (daily support 2).
 English
 Русский
 Bahasa Indonesia
 Bahasa Malay
 ไทย
ไทย Español
 Deutsch
 Български
 Français
 Tiếng Việt
 中文
中文 বাংলা
বাংলা हिन्दी
 Čeština
 Українська
 Română

