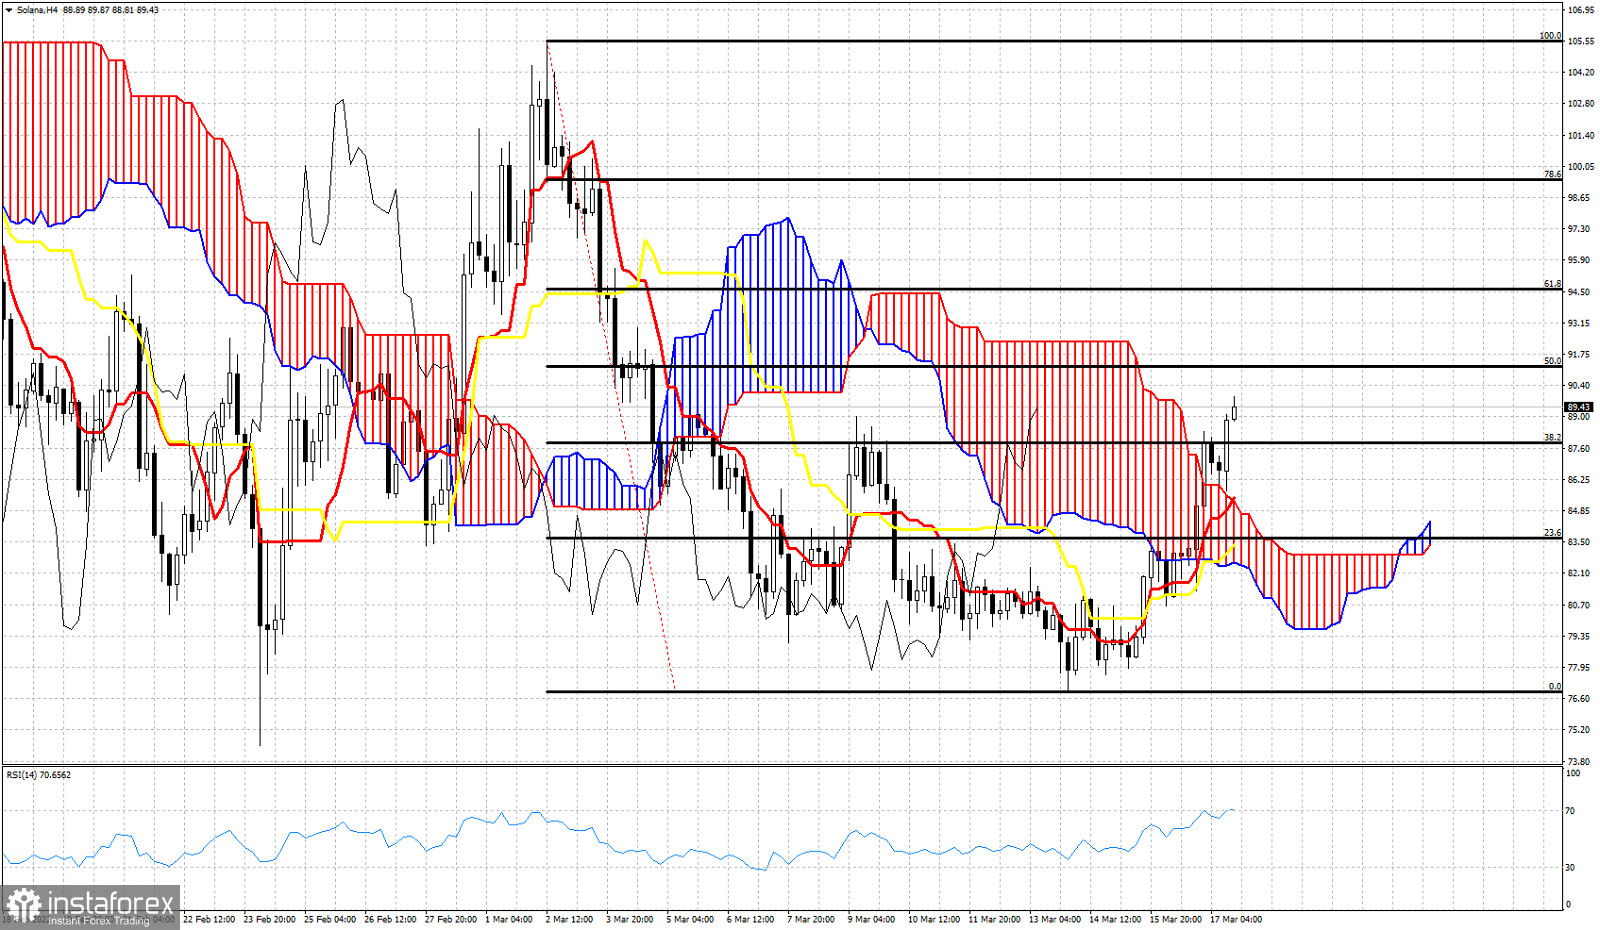
In the 4 hour chart price of Solana has broken above the Kumo (cloud) resistance. This is a sign of strength. If this will change into a bigger reversal it is too soon to tell. Nevertheless this is a bullish sign after a long time.

Price is moving above the cloud and is making higher highs and higher lows. Support by the cloud is at $84.60-$84.90 area. Price is above both the tenkan-sen and kijun-sen indicators. The tenkan-sen (red line indicator) has crossed above the kijun-sen (yellow line indicator). These are bullish signals. However this is only in the 4 hour time frame so traders need to be cautious. Bulls need to defend the cloud support and not let price break below it again. Next upside target is at the 50% retracement at $91.20 and next and most important Fibonacci resistance is found at $94.65. Breaking above $94.65 would be an important bullish signal.
 English
 Русский
 Bahasa Indonesia
 Bahasa Malay
 ไทย
ไทย Español
 Deutsch
 Български
 Français
 Tiếng Việt
 中文
中文 বাংলা
বাংলা हिन्दी
 Čeština
 Українська
 Română

