 English
  Русский
 Bahasa Indonesia
 Bahasa Malay
 ไทย
ไทย Español
 Deutsch
 Български
 Français
 Tiếng Việt
 中文
中文 বাংলা
বাংলা हिन्दी
 Čeština
 Українська
 Română

Trend Analysis (figure 1).
Today, the market will try to continue going down from the level of 1.3577 (closing of yesterday's daily candle) with the target of 1.3530 at the support line (red bold line). When this line is reached, the price can continue to go down with the target of 1.3421 - 13 average EMA (yellow thin line).
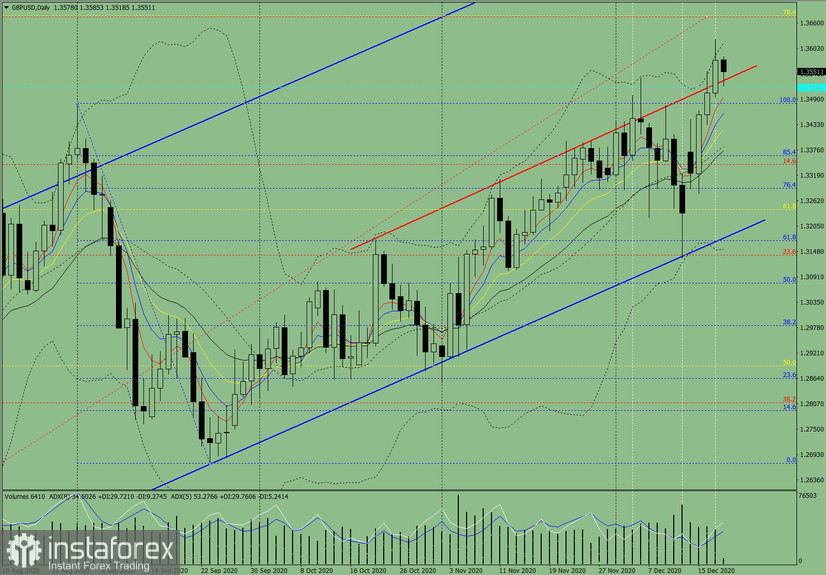
Figure 1 (daily chart).
Comprehensive Analysis:
- Indicator Analysis - down
- Fibonacci Levels - down
- Volumes - down
- Technical Analysis - down
- Trend Analysis - down
- Bollinger Bands - down
- Weekly Chart - down
General Conclusion:
Today, the price will try to continue going down from the level of 1.3577 (closing of yesterday's daily candle) with the target of 1.3530 at the support line (red bold line). When this line is reached, the price can continue to go down with the target of 1.3421 - 13 average EMA (yellow thin line).
Alternative scenario: when going down and reaching the target of 1.3530 at the support line (red bold line), the price may start going up with the target of 1.3623 upper fractal (daily candle from 17.12.2020). When this level is reached, it will continue to go up to the target of 1.3677 at the rollback level of 76.4% (yellow dotted line).